Wize University Psychology Textbook > Research Methods in Psychology
Descriptive Statistics
Popular Courses
MCAT
General Course
Psychology
University Study Guides
PSYC 100A
Queen's University
PSYCH 1000
Western University
PSYCH 1X03
McMaster University
PSYCH 104
University of Alberta
PSYCH 1002
Western University
PSYC 1000
University of Guelph
Psychology
University Study Guides
PSYC 100
McGill University
PSY100H1
University of Toronto
PSYC 101
University of British Columbia
PSYC 1010
York University
PSYC 200
University of Calgary
PSYC 102
University of British Columbia
PSYC 100B
Queen's University
PSYC 100A
University of Victoria
PSYC 200
Concordia University
PSYC 1004
Virginia Tech
PSYCH 100
Pennsylvania State University

0:00 / 0:00
Descriptive Statistics
Descriptive statistics are used to describe characteristics of a sample. You aren't making a claim about the whole population - just the people you actually studied.
There are three main types of descriptive statistics:
- Central tendency - what is the average or typical data point?
- Dispersion - how far apart are the data points?
- Correlation - how related are values on two variables?
Central Tendency
Central tendency tells us what the typical or average data point is. There are three ways to measure central tendency:
- Mean - the average of all of the data points in a set.
- Median - when data points are arranged in numerical order, the center data point. If there are an even number of data points, take the average of the two on either side of the center.
- Mode - the most frequently occurring value(s) in a set.
Note: the mean is the most frequently used measure of central tendency, but it isn't always the best choice:
- In a very skewed distribution, the mean is most affected by extreme values.
- For nominal and ordinal data, using the mean doesn't make any sense.
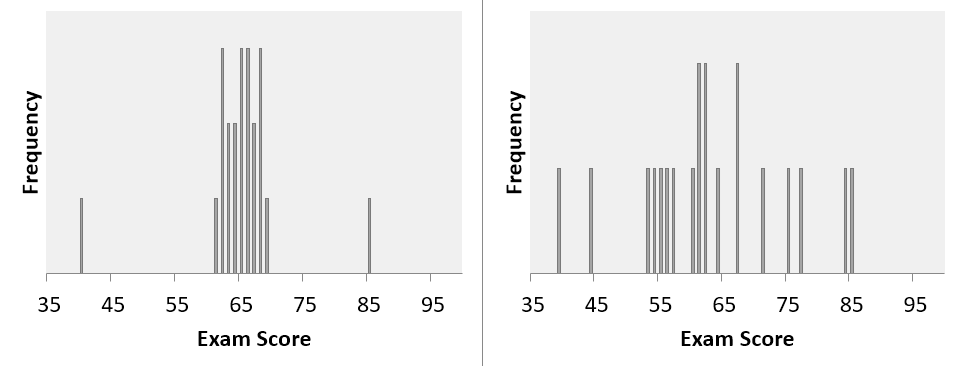
Dispersion
Dispersion tells us how spread out the data points are. There are two main ways to measure dispersion:
- Range - the distance from the lowest data point to the highest data point
- Standard Deviation - the average distance between data points and the mean
Practice: Descriptive Statistics
Jaime conducted a survey of his class, asking what their favourite hockey team was. Which measure of central tendency is most appropriate for his data?