Wize University Statistics Textbook > Inference for Two Population Proportions
Hypothesis Testing for Two Proportions
Popular Courses
STAT 151
University of Alberta
AP Statistics Exam Prep Course
AP Exam Prep
Statistics
General Course
Intro to Statistics
University Study Guides
COMM 191
University of British Columbia
STA 100
University of California - Davis
STATS 2244A/B
Western University
Intro to Statistics
University Study Guides
STATS 2035
Western University
STAT 161
University of Alberta
QMS 210
Toronto Metropolitan University
STAT 263
Queen's University
STAT*2040
University of Guelph
MGCR 271
McGill University
STAT 251
University of British Columbia
STATS 2B03
McMaster University
STAT 217
University of Calgary
COMM 162
Queen's University
STAT 1060
Dalhousie University
ECON 227
McGill University
0:00 / 0:00
Comparing Two Independent Proportions

The inference two independent proportions entails comparing the proportions of successes of two populations. In this chapter, the measurement is the number of successes and failures of individuals or observations from each population. We can also compare success rates between two treatments.
Wize Concept
A sample proportion is equal to the number of successes divided by the sample size :
You can think of "successes" as the number of those who responded "YES" in your sample.
Examples
- We compare the proportion of employees (%) who got bonuses in the Marketing and IT departments (two populations).
- We compare the survival rates (%) between natural remedies and medication (two treatments).
How to identify this type of situation
- There are two samples: {Sample 1, Sample 2}
- Each sample is randomly drawn from different, non-overlapping populations.
- Sample 1 is drawn from Population 1 with (number of successes in Sample 1)
- Sample 2 is drawn from Population 2 with (number of successes in Sample 2)
- The two populations are independent (there is no matching of individuals or observations in the two samples)
- One group could be split into two randomly assigned treatments (randomized comparative experiment), in which case we can then compare the responses (comparing two proportions).
- Let . Each of the two samples will consist of:
- Sample proportion
- Sample size
- It's okay if sample sizes differ as they do not need to be equal.
- Central Limit Theorem applies:
- If both population distributions are normal, then the sample sizes do not need to be large.
- If both population distributions are not normal, then the sample sizes need to be large.
- When in doubt, you should have sufficiently large sample sizes.
Summary

Example
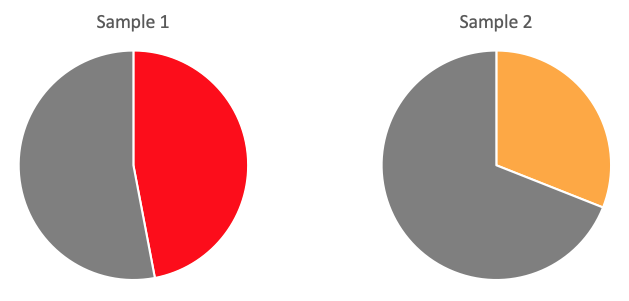
To make inferences about the difference in the population proportions (parameter), we use the difference in the sample means (statistic).
Wize Concept
Inferences includes hypothesis tests and confidence intervals.
0:00 / 0:00
Hypothesis Test Steps: Comparing Two Proportions
We can compare the two population proportions by running a hypothesis test.
Wize Tip
Review Hypothesis Testing if you need a refresher of the five steps. (See: Hypothesis Testing with One Sample)
- Step 1: State the hypotheses
- Is this a one-sided or two-sided test?
- To make inferences about the difference in the population proportions (two-sided test), the hypotheses are:
- You can also test if one population proportion is greater/less than the other population proportion at either direction (one-sided test), depending on the question:
OR
- Step 2: Note the significance level
- You may find the critical value, depending on and # of sides
- Step 3: Locate the relevant variables and run the appropriate test
- Find
- Solve for and :
- Test statistic for comparing two proportions:
- where is the pooled sample proportion (or combined sample proportion):
Wize Concept
Why do we use a pooled sample proportion when comparing two proportions?
- When conducting hypothesis tests and calculating the p-value, we assume that the null hypothesis is true. Then, for comparing two proportion, we assume that and are equal.
- With this assumption, you can say that both and are estimating the same unknown proportion.
- Thus, we pool the two samples to estimate a single proportion instead of combining and separately.
- Step 4: Find the p-value
- The p-value is based on your test statistic and # of sides
- If p-value Reject
- If p-value Fail to reject
- You can also compare the critical value with the test statistic
- If Reject
- If Fail to reject
- Step 5: Draw your conclusion
- If you reject , you conclude that there is evidence for . Example: "There is evidence that the proportions differ."
- If you fail to reject , you conclude that there is no evidence for . Example: "There is no evidence that the proportions differ."
0:00 / 0:00
Example: Hypothesis Test for Differences in Population Proportions
Don King is running for mayor in Twin Pines. Based on a random sample of 60 male voters in Twin Pines, 44 of them said they view him favorably. Based on a random sample of 50 female voters in Twin Pines, 30 of them said they view him favorably.
At the 5% significance level, is there evidence that there is a difference between male and females in terms of the proportion of those who view him favorably?
(a) Solve for and :
(b) Solve for the pooled sample proportion :
(c) State the hypotheses.
We are testing for the difference in proportions, so this is a two-sided test.
(d) Find the critical value .
This is a two-sided test with a 5% significance level. Although we are looking for , we will use the column at the bottom of the -table. (This is easier than using the z-table.)

(e) Solve for the test statistic for comparing two proportions:
(f) What is the p-value?
We will use the z-table to find the p-value.

Watch Out!
For two-sided tests, don't forget to double the p-value! Many students forget!
p-value
(g) Draw your conclusion.
- p-value Fail to reject
- You can also say that the absolute value of the test statistic is greater than the absolute value of the critical value ( Fail to reject
At the 5% significance level, there is no evidence that there is a difference between male and females in terms of the proportion of those who view him favorably.
There are two restaurants at the amusement park: Hucklebee's Tavern (Population 1) and Cafe Isabelle (Population 2). Random samples are taken from each restaurant so we can the proportions of customers that tip. Here are the results:
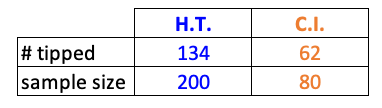
At the 5% significance level, we want to determine if the proportion of customers that tip differ between the two restaurants.
(i) State the hypotheses.