Wize University Statistics Textbook > Analysis of Variance
Hypothesis Testing for One-Way ANOVA
Popular Courses
STAT 151
University of Alberta
Statistics
General Course
Intro to Statistics
University Study Guides
STA 100
University of California - Davis
STATS 2244A/B
Western University
STAT 200
University of British Columbia
Intro to Statistics
University Study Guides
STATS 2035
Western University
STAT 161
University of Alberta
QMS 210
Toronto Metropolitan University
STAT 263
Queen's University
STAT*2040
University of Guelph
STAT 251
University of British Columbia
STATS 2B03
McMaster University
STAT 217
University of Calgary
MGTSC 212
University of Alberta
STAT 1060
Dalhousie University
STAT*2060
University of Guelph
BIOL 243
Queen's University
PSYC 204
McGill University

0:00 / 0:00
One-Way ANOVA Hypothesis Test
To perform a hypothesis test for the difference in several means, you will need the following information:
- The ANOVA table or the raw data (if you can use software)
- The number of groups or samples
- The significance level
- If it is not provided, you should assume it's 0.05 or see how small or large the p-value is.
Wize Tip
You must know this table:

Hypothesis Test Five Steps
Wize Tip
Review Hypothesis Testing if you need a refresher of the five steps. (See: Hypothesis Testing with One Sample)
- Step 1: Locate the relevant variables and identify the situation
- Determine if the question has more than two SRS, the populations are normally distributed, independent, and the variance of the populations can be assumed to be equal.
- Find the significance level .
- Determine the number of samples .
- Fill in or construct the ANOVA table.
- Step 2: State the hypotheses
- In this step we need to determine the null hypothesis and the alternative hypothesis (also sometimes denoted ).
- The null hypothesis
- (the population means are all equal)
- This implies the treatments had no impact on the means.
- The alternative hypothesis
- at least one of the means is different from the others
- This implies treatments don't all have the same impact.
- Thus, the hypothesis statement takes the form:
- at least one of the means is different from the others
- Step 3: Calculate the Test Statistic
- Test statistic
- The F-distribution has two degrees of freedom
- (degrees of freedom for "Between Groups")
- (degrees of freedom for "Within Groups")
- where is the overall sample size.
- Step 4: Decision Rule
- Find the p-value to compare with the significance level
- The p-value should either be given in the ANOVA table or obtained using software
- Alternatively, you can find the critical value to compare with the F statistic
- You can find the critical value using the appropriate F-table, given the significance level and degrees of freedoms ()
- Step 5: Conclusion
- If p-value Reject
- We have enough statistical evidence to conclude that at least one of the population mean differs.
- If p-value Fail to reject
- We do not have enough statistical evidence to conclude that at least one of the population mean differs.

0:00 / 0:00
Example: One-Way ANOVA Hypothesis Testing
Max Powers is a billionaire who owns three hockey teams. Each team has coaches with very different approaches:
- Team A is coached by a ruthless man with anger management issues;
- Team B is coached by a retired nurse and grandmother of three;
- Team C is coached by a yoga instructor
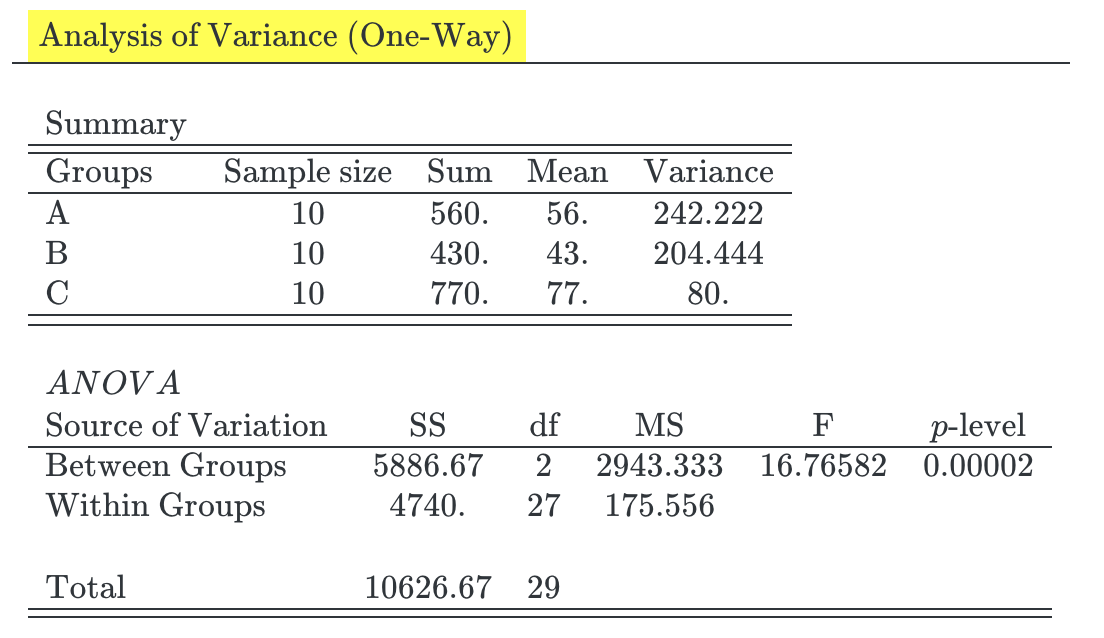
To test if his three teams differ in performance, Max compared them based on their average total points per season:
Step 1: Locate the relevant variables and identify the situation
- The following information is provided in the question:
- (No significance level provided so we assumed this)
- ANOVA table is provided.
- In this situation we know we have to use a one-way ANOVA test because:
- The question has more than two SRS.
- Populations are normally distributed (we aren't told anything in particular so we can assume).
- Populations are independent (again nothing specific is said so you can simply assume).
- The variance of the populations can be assumed to be equal (again nothing specific is said so you can simply assume).
Step 2: State the hypotheses
Step 3: Calculate the Test Statistic
Step 4: Decision Rule
- P-Value (given in ANOVA table)
Step 5: Conclusion
- therefore we reject H0. At the 5% level of significance, we have enough evidence to reject H0. At least one of the means differs from the other ones.
*Note that since we p-value is provided in the ANOVA table we could have skipped Steps 3, 4 and used that directly for the conclusion.
Practice: One-Way ANOVA
The Real Housewives of Beverly Hills, Orange County, Atlanta, and New York are arguing in a limo about which city charges the most for nose jobs.
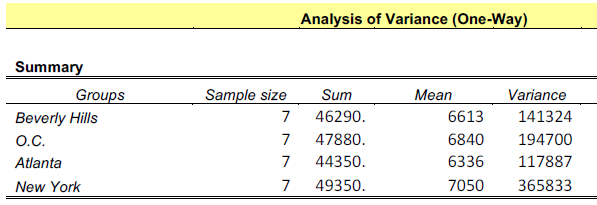
(a) Which of the following are the correct set of hypotheses?