Popular Courses
STAT 151
University of Alberta
AP Statistics Exam Prep Course
AP Exam Prep
Statistics
General Course
Intro to Statistics
University Study Guides
COMM 191
University of British Columbia
STA 100
University of California - Davis
STATS 2244A/B
Western University
STAT 200
University of British Columbia
Intro to Statistics
University Study Guides
STATS 2035
Western University
STAT 161
University of Alberta
QMS 210
Toronto Metropolitan University
STAT 263
Queen's University
STAT*2040
University of Guelph
ENDG 319
University of Calgary
MGCR 271
McGill University
STAT 251
University of British Columbia
STATS 2B03
McMaster University
STAT 217
University of Calgary
COMM 162
Queen's University

0:00 / 0:00
Hypothesis Test for Two Independent Means: Unpooled t-test for Unequal Variances
Our approach to comparing the two means depends if we if can assume the population variances and are equal or not, even if we don't know their values.
If we cannot assume that the population variances are equal Unpooled t-test (Unequal Variances t-test)
Degrees of freedom:
With software:
Without software (and if allowed):
Wize Concept
If you are doing a Pooled t-test, there is an additional assumption which is that .
0:00 / 0:00
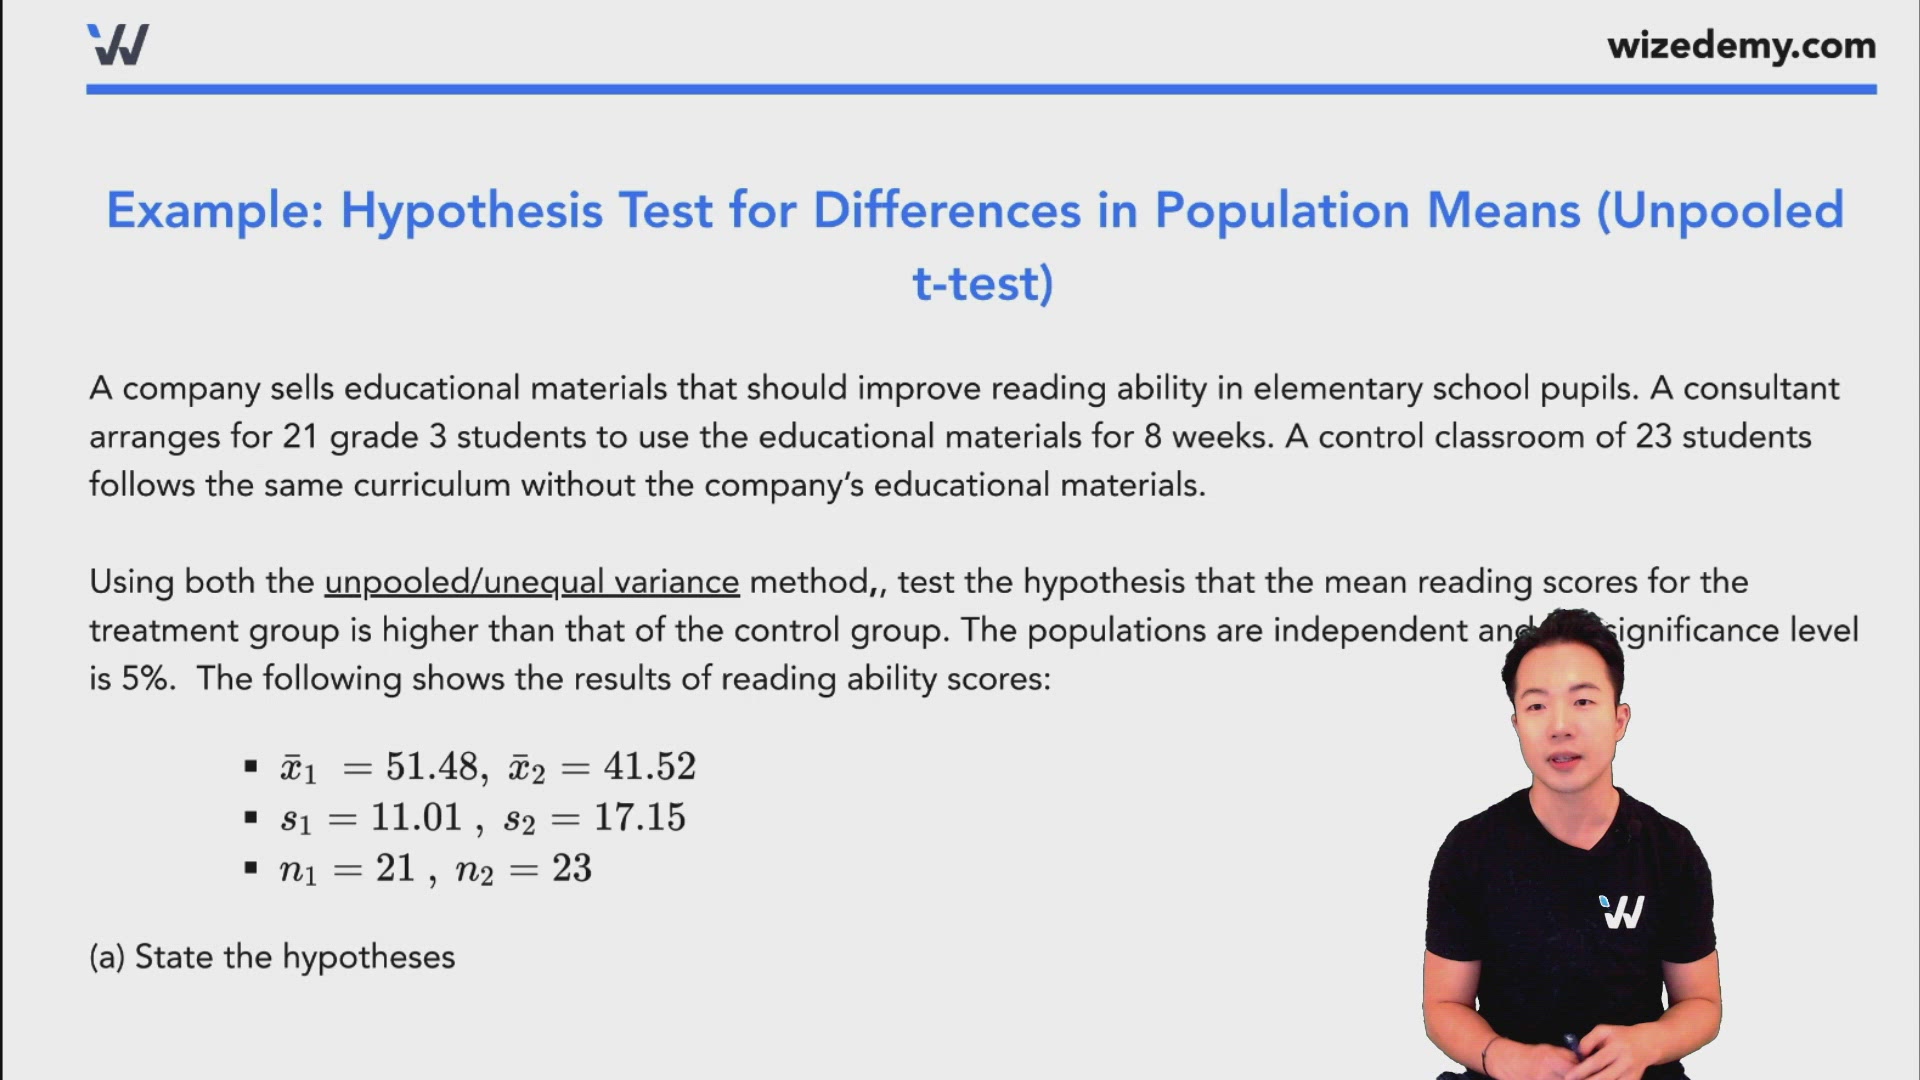
Example: Hypothesis Test for Differences in Population Means (Unpooled t-test)
A company sells educational materials that should improve reading ability in elementary school pupils. A consultant arranges for 21 grade 3 students to use the educational materials for 8 weeks. A control classroom of 23 students follows the same curriculum without the company’s educational materials.
Using the unpooled/unequal variance method, test the hypothesis that the mean reading scores for the treatment group is higher than that of the control group. The populations are independent and the significance level is 5%. The following shows the results of reading ability scores:
(a) State the hypotheses
Based on the keyword "higher", this is a one-sided test.
(b) Calculate the Unpooled/Unequal Variance test statistic and its degrees of freedom:
Degrees of freedom:
Method #1
Method #2
(c) Find the range of p-values for each method. (Use the closest available provided in the table.)

t=2.31, df=37 30 or 40:
- From t-table, p-value
t=2.31, df=20:
- From t-table, p-value
In both methods, p-value
(d) Draw your conclusion. Are reading scores for the treatment group is higher than that of the control group?
- therefore we reject .
- At the 5% level of significance, we have enough evidence to reject .
- The mean reading score of the treatment group is significantly greater than the mean reading score of the control group.
In a random sample of 18 non-smokers (Group 1), they lived on average 69 years with a standard deviation of 4.4 years. In a random sample of 20 smokers (Group 2), they lived on average 66 years with a standard deviation of 2 years.
Assumptions:
- Both populations are normal
- The population variances are not assumed to be equal
At the 1% level of significance, we want to determine if there is evidence that non-smokers live longer than smokers.
(i) State the hypotheses.