Wize University Statistics Textbook > Test of Equality of Two Variances
F-Test for Equality of Two Variances
Popular Courses
Statistics
General Course
Intro to Statistics
University Study Guides
STA 100
University of California - Davis
Intro to Statistics
University Study Guides
STATS 2035
Western University
QMS 210
Toronto Metropolitan University
STAT*2040
University of Guelph
STATS 2B03
McMaster University
COMM 162
Queen's University
ECON 227
McGill University
STA 2391
University of Ottawa
STAT-2910
University of Windsor
Stats 8
Oregon State
STAT 1000
University of Manitoba
STAT 252
University of Victoria
COMM 1503
Dalhousie University
STAT 265
University of Alberta
ADM 2303
University of Ottawa
STAT 202
University of Waterloo
STAT 371
University of Wisconsin - Madison

0:00 / 0:00
F-Test for Equality of Two Variances
Purpose: To test if two population variances are equal.
Assumptions:
- If two populations are normal F-test
- If two populations are not normal Levene’s Test
Watch Out!
When we ask "Are the two populations normal?", it means the samples are both drawn from normal population distributions. Central Limit Theorem does not apply because having a large sample only makes the sampling distribution normal but it doesn't change the fact that the population distributions are normal or not.
Hypotheses:
“The two populations variances are equal.”
“The two populations variances are not equal.”
Test Statistic:
Important: The larger sample variance should be put in the numerator, and the smaller sample variance is put in the denominator. This forces the F-test to always be a right-sided test, which makes things a lot easier.
If the variances are equal , then .
Wize Tip
If you are given sample standard deviations instead (i.e. and ), then be sure to square them both when solving for the F-stat:
The F-test has two degrees of freedom:
P-value method:
- If you are able to solve for the p-value using software, ensure that the p-value is doubled for two-tailed tests.
- In order to reject , the p-value needs to be smaller than the significance level .
Critical value method:
- Without software, use to F-table to find the critical value.
- For two-tailed tests, divide by 2 to find the critical value .
- In order to reject , the test statistic needs to be bigger than the critical value.
Example
“The two populations variances are equal.”
“The two populations variances are not equal.”
Find the critical value.
This is a two-tailed test, so
We will therefore use the 5% F-table.

CV:

0:00 / 0:00
Example: F-Test for Equality of Two Variances
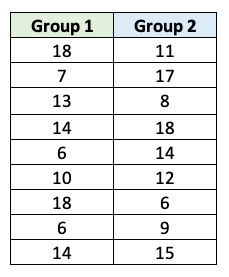
We want to test if the variances in Group 1 and Group 2 are equal or not. Assume both population distributions are normal. The sample standard deviation in Group 1 is and the sample standard deviation in Group 2 is .
Raw data:
(i) State the hypotheses.
“The two populations variances are equal.”
“The two populations variances are not equal.”
(ii) . Find the critical value.
This is a two-tailed test, so
We will therefore use the 5% F-table.
You need the degrees of freedoms first.

Critical value
In order to reject , the test statistic needs to be bigger than the critical value (3.438).
(iii) Find the test statistic.
(iv) Refer to the software output below. Is the evidence that the variances differ?
P-value method:
P-value (0.689) > alpha (0.10) Fail to reject . There is no evidence that the variances differ.
Critical value method:
Test statistic (1.34) < critical value (3.438) Fail to reject . There is no evidence that the variances differ.
Minitab Output:
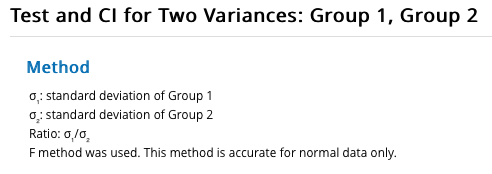
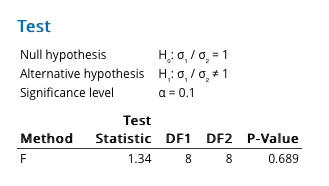
Note: Since this is a two-tailed test, Minitab had doubled the p-value.
Portions of information contained in this publication/book are printed with permission of Minitab, LLC. All such material remains the exclusive property and copyright of Minitab, LLC. All rights reserved.

Mark Yourself Question
- Grab a piece of paper and try this problem yourself.
- When you're done, check the "I have answered this question" box below.
- View the solution and report whether you got it right or wrong.
Practice: F-Test for Equality of Two Variances
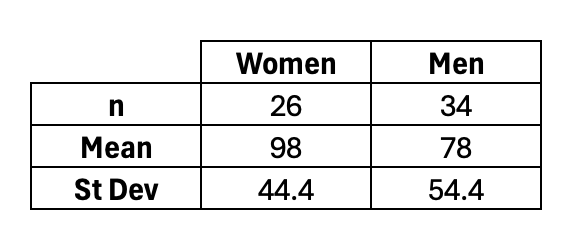
A random sample of 26 women and 34 men were selected. The time spend at the mall (in minutes) are recorded.
Descriptive statistics:
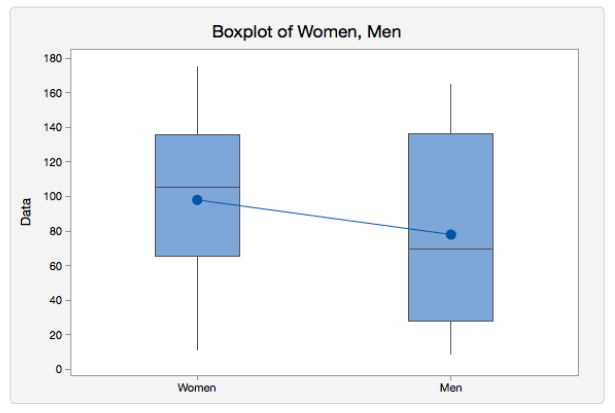
(a) Describe the two distributions.
(b) Looking at the boxplots, what can you say about the variation of time spend at the mall?
(c) Conduct a test for the equality of the two population variances (). State the hypotheses and draw your conclusion.
Useful information from Minitab:
Sample 1: Men
Sample 2: Women
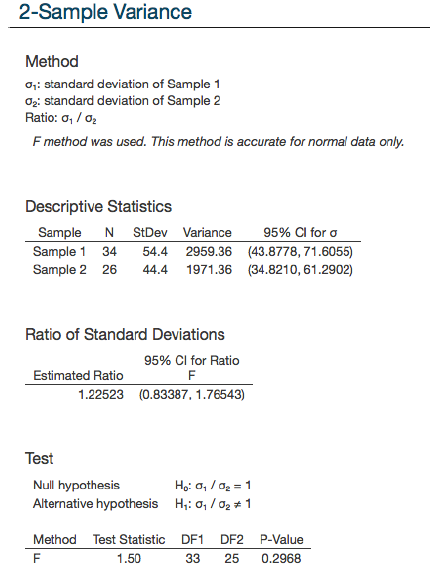
Note: Since this is a two-tailed test, Minitab had doubled the p-value.
(d) Which t-test should we do: pooled or non-pooled?
Portions of information contained in this publication/book are printed with permission of Minitab, LLC. All such material remains the exclusive property and copyright of Minitab, LLC. All rights reserved.