Wize University Statistics Textbook > Exploratory Data Analysis
Skewness and Symmetry
Popular Courses
STAT 151
University of Alberta
AP Statistics Exam Prep Course
AP Exam Prep
Statistics
General Course
Intro to Statistics
University Study Guides
Algebra I
US High School
COMM 191
University of British Columbia
STAT 213
University of Calgary
DATASCI 1000
Western University
STA 100
University of California - Davis
Grade 12 Data Management
Ontario High School
High School Statistics
US High School
STATS 2244
Western University
STATS 2244
Western University
STAT 200
University of British Columbia
Intro to Statistics
University Study Guides
STATS 2035
Western University
STAT 161
University of Alberta
QMS 210
Toronto Metropolitan University
STAT 263
Queen's University
STAT 2040
University of Guelph

0:00 / 0:00
Skewness and Symmetry
For quantitative data, you can plot them into a histogram and observe how they are distributed. Are the data distributed evenly or are they skewed to one direction?
Consider these three unimodal distributions:
Symmetric Distribution

Mean = Median
Examples of symmetric distributions:
- Exam grades
- Time it takes to commute to work
Left-Skewed Distribution (a.k.a. Negatively Skewed Distribution)

Mean < Median
Examples of left-skewed distributions:
- Time people spend at a concert (very few people leave early; most people stay to the end)
- Age of death (very few people die young; many people die old)
Right-Skewed Distribution (a.k.a. Positively Skewed Distribution)
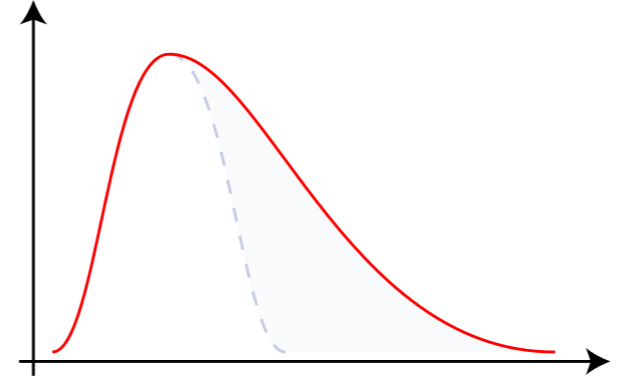
Mean > Median
Examples of right-skewed distributions:
- Number of bedrooms of homes (most homes have 1 or 2 bedrooms; few have many bedrooms)
- Salary of employees (few employees earn very high salaries, like top executives)
Practice: Skewness
For each of the following distributions, determine if it is more likely to be symmetric, skewed to the right, or skewed to the left.
(i) Number of pets in a household.