Wize University Statistics Textbook > Hypothesis Testing with One Sample
Hypothesis Test for a Mean
Popular Courses
COMM 214
Concordia University
STAT 151
University of Alberta
AP Statistics Exam Prep Course
AP Exam Prep
Statistics
General Course
Intro to Statistics
University Study Guides
COMM 215
Concordia University
STAT 213
University of Calgary
COMM 191
University of British Columbia
STA 100
University of California - Davis
Grade 12 Data Management
Ontario High School
STATS 2244A/B
Western University
STAT 200
University of British Columbia
Intro to Statistics
University Study Guides
STATS 2035
Western University
STAT 161
University of Alberta
QMS 210
Toronto Metropolitan University
STAT 263
Queen's University
STAT*2040
University of Guelph
ENDG 319
University of Calgary
MGCR 271
McGill University

0:00 / 0:00
Hypothesis Test for a Mean
A hypothesis test may be performed for a population mean . Be sure to review the hypothesis test steps before studying this section.
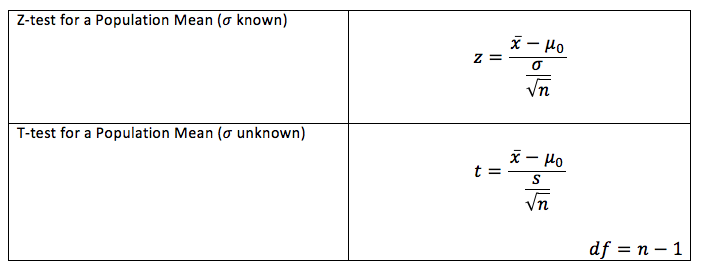
The test statistic is depends on 3 things:
- Whether the population standard deviation is known or not
- Whether the population distribution is normal or not
- Sample size

(if is known)
(if is unknown)
0:00 / 0:00
Example: Hypothesis Test (Mean) - One-Sided Test
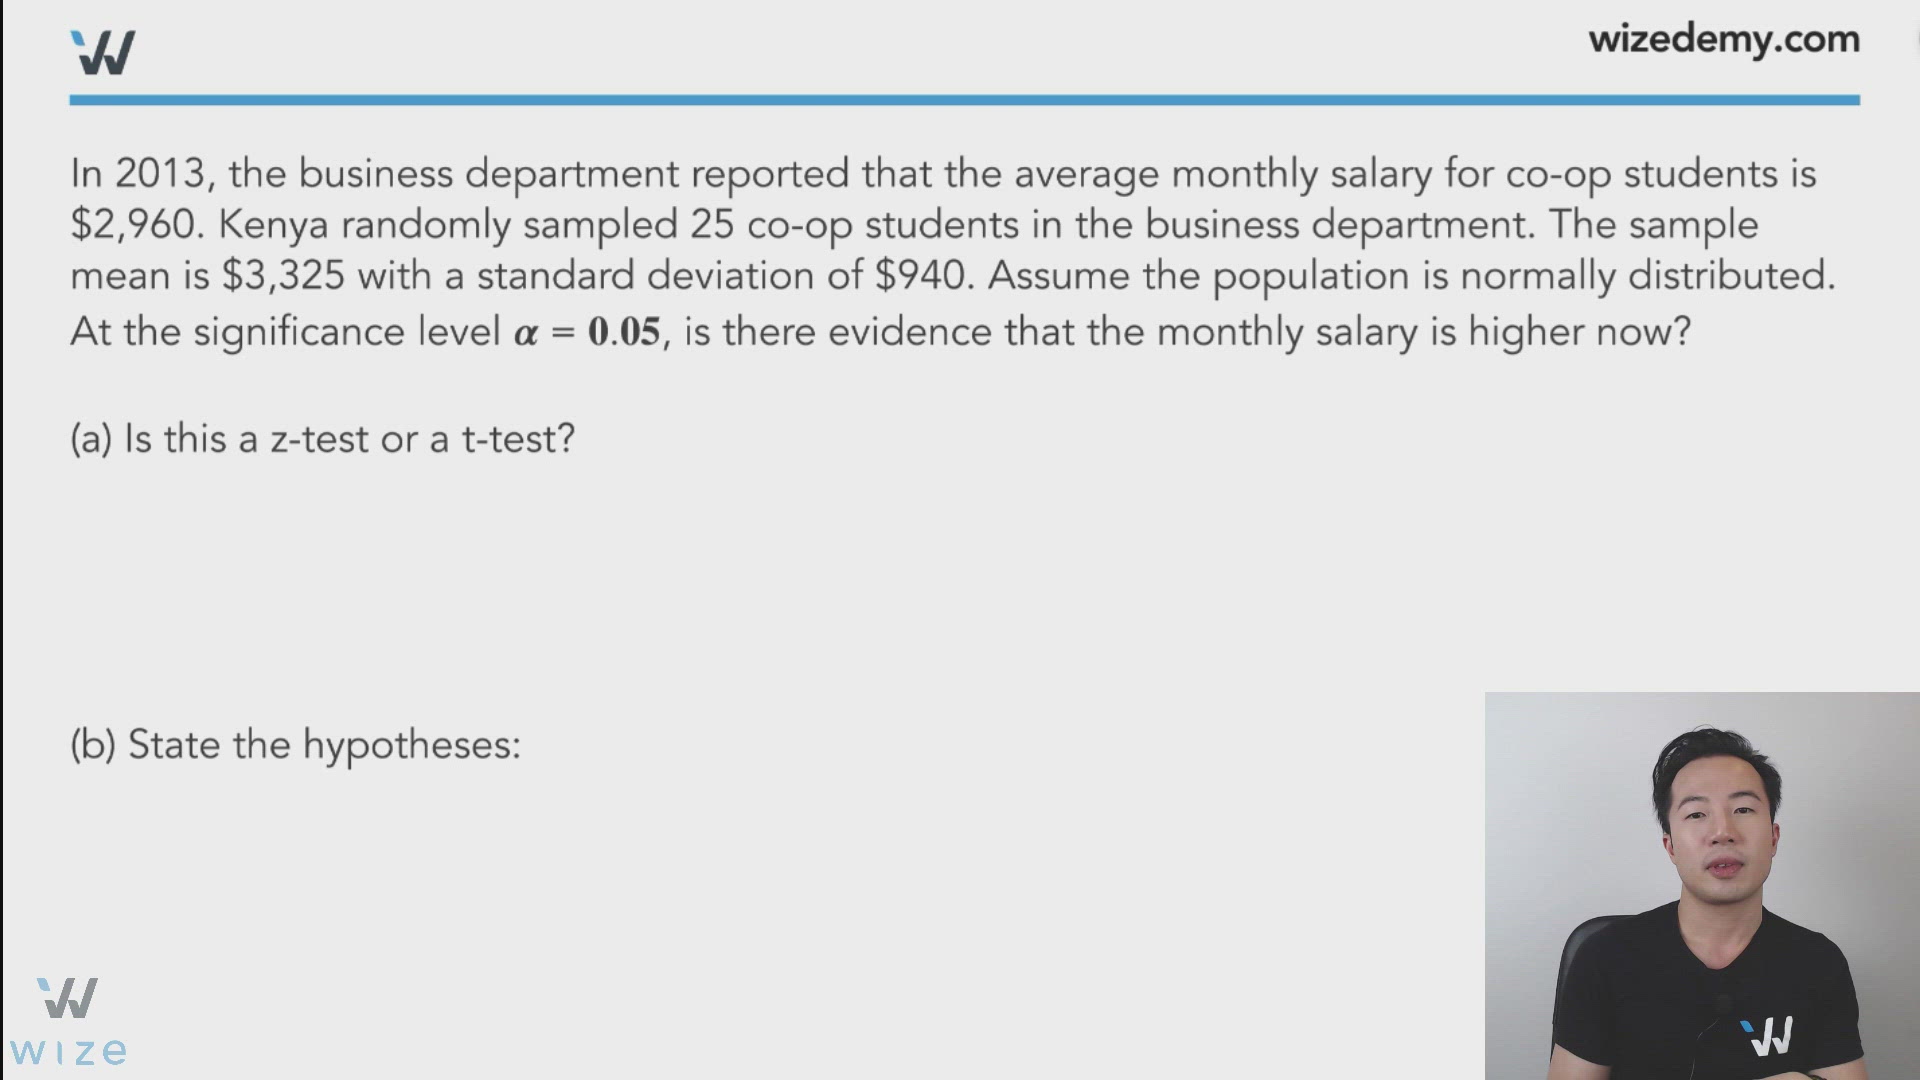
In 2013, the business department reported that the average monthly salary for co-op students is $2,960. Kenya randomly sampled 25 co-op students in the business department. The sample mean is $3,325 with a standard deviation of $940. Assume the population is normally distributed. At the significance level , is there evidence that the monthly salary is higher now?
(a) Is this a z-test or a t-test?
This is a t-test because is unknown. Although the sample size is not very large, the population is assumed to be normal so we can proceed with the t-test.
(b) State the hypotheses:
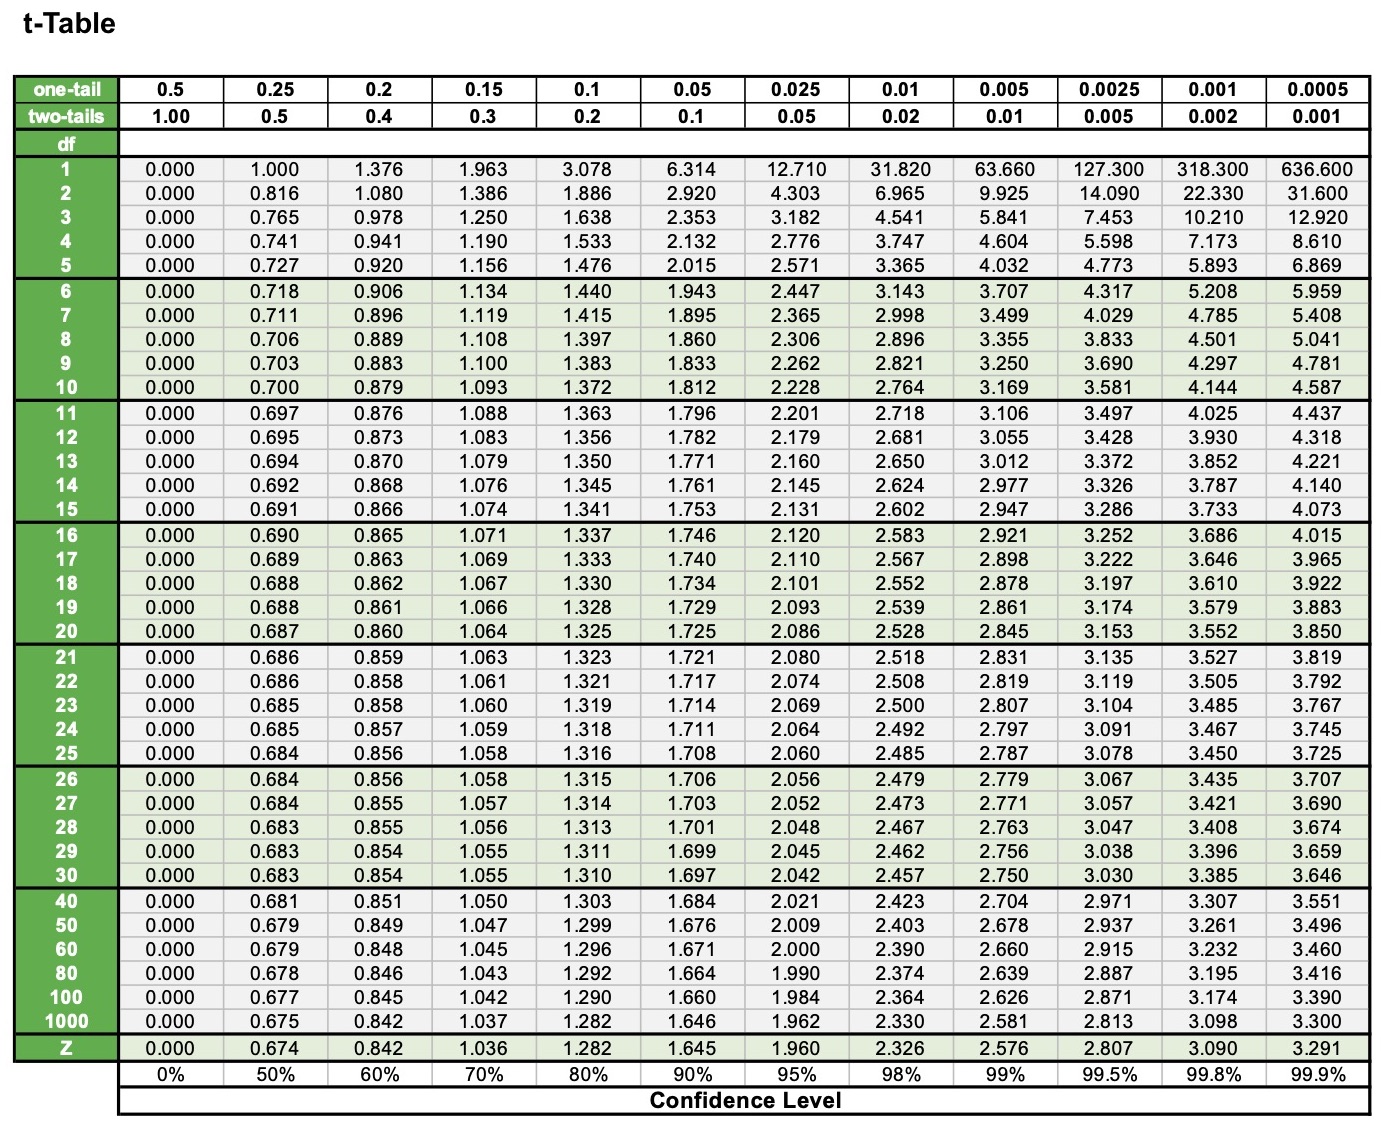
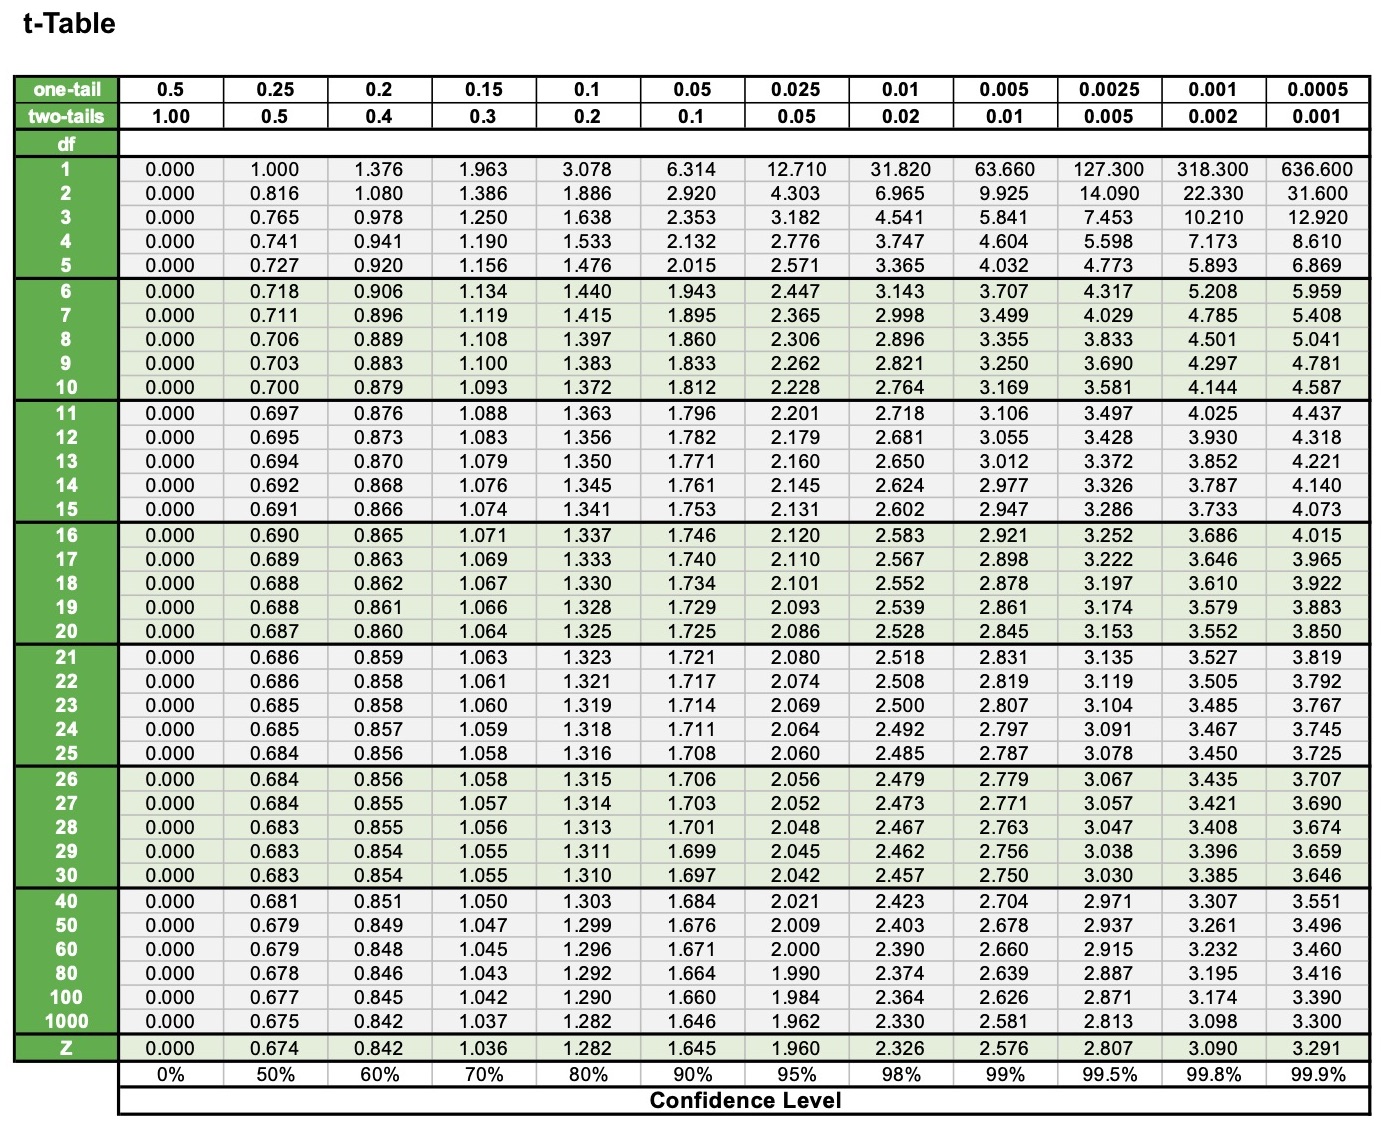
(c) What is the critical value?
one-tail test ("greater than")
𝜶 = 𝟎.𝟎𝟓
(t-table)
(d) Find the test statistic:
(e) Find the p-value.
t-table: p-value
Software: p-value = 0.032
(f) Select the correct conclusion:
i. We reject 𝐻o; there is evidence that the monthly salary is higher now.
ii. We reject 𝐻o; there is no evidence that the monthly salary is higher now.
iii. We fail to reject 𝐻o; there is evidence that the monthly salary is higher now.
iv. We fail to reject 𝐻o; there is no evidence that the monthly salary is higher now.
i. The p-value is smaller than the significance level (0.05). We reject ; conclude as per : there is evidence that the monthly salary is higher now.
You can also say: The test statistic (1.942) is greater than the critical value (1.711). Reject Ho.
There is evidence that the average co-op salary is greater than $2,960.
(g) What would be the conclusion if ?
i. We reject 𝐻o; there is no evidence that the monthly salary is higher now.
ii. We fail to reject 𝐻o; there is evidence that the monthly salary is higher now.
iii. We fail to reject 𝐻a; there is no evidence that the monthly salary is the same.
iv. We fail to reject 𝐻o; there is no evidence that the monthly salary is higher now.
iv. The p-value is greater than the significance level (0.01). Fail to reject . (You do not reject !)
There is no evidence that the average co-op salary is greater than $2,960.
If you are curious, the critical value at a = 0.01 is 2.492
The test statistic (1.9415) is smaller than the critical value (2.492). Fail to reject Ho.
(h) What does that say about the strength of the evidence?
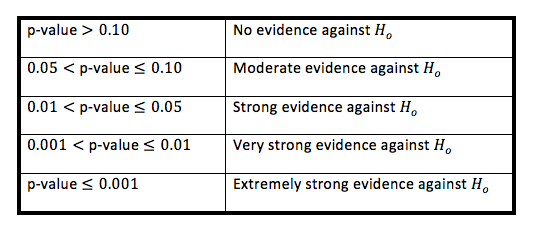
Since we can reject Ho at a = 0.05 but not at a = 0.01, we can say that there is strong evidence but not very strong.

0:00 / 0:00
Example: Hypothesis Test (Mean) - Two-Sided Test
The average time it takes to find a parking spot at the mall is 11.5 minutes. However, the mall's property was recently rezoned. Has the average time to find a parking spot changed since the rezoning? Based on a random sample of 41 cars, the average time for shoppers to find a parking spot is 10.25 minutes with a standard deviation of 4.5 minutes. The significance level is .
(a) Is this a z-test or a t-test?
This is a t-test because is unknown. Although the sample size is not very large, the population is assumed to be normal so we can proceed with the test.
(b) State the hypotheses:
(c) What is the critical value?
two-tail test ("changed")
𝜶 = 𝟎.𝟎𝟓
(t-table)
(d) Find the test statistic:
(e) Find the p-value. (Remember: this is a two-tail test!)
t-table: p-value (be sure to find the correct p-value based on a two-tail test!)
Software: p-value = 0.0829
(f) Select the correct conclusion:
i. There is evidence that the average time to find a parking spot has decreased.
ii. There is evidence that the average time to find a parking spot has changed.
iii. There is evidence that the average time to find a parking spot has not changed.
iv. There is no evidence that the average time to find a parking spot has changed.
iv. The p-value is greater than the significance level (0.05). We fail to reject , then we have no evidence for .
(iii. is not correct - we didn't prove that is true.)
The marketing department states that the average spending at the store is $335, but they believe that customers are spending less money, on average. A random sample of 31 customers reveal a mean of $302 with a standard deviation of $128.
(i) What are the correct hypotheses?