Wize University Statistics Textbook > Estimating with Confidence Intervals
Confidence Interval for a Proportion
Popular Courses
COMM 214
Concordia University
STAT 151
University of Alberta
AP Statistics Exam Prep Course
AP Exam Prep
Statistics
General Course
Intro to Statistics
University Study Guides
COMM 215
Concordia University
STAT 213
University of Calgary
COMM 191
University of British Columbia
DATASCI 1000A/B
Western University
STA 100
University of California - Davis
Grade 12 Data Management
Ontario High School
STATS 2244A/B
Western University
STAT 200
University of British Columbia
Intro to Statistics
University Study Guides
STATS 2035
Western University
STAT 161
University of Alberta
QMS 210
Toronto Metropolitan University
STAT 263
Queen's University
STAT*2040
University of Guelph
ENDG 319
University of Calgary

0:00 / 0:00
Confidence Interval for a Proportion
The population proportion is the parameter we are trying to estimate using the sample proportion , which is the statistic or estimate.
The confidence intervals used to estimate the population proportion is
where,
- is the margin of error.
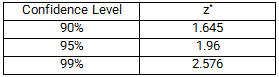
The confidence level corresponds to its “multiplier” value:
Watch Out!
Remember: We only use for proportions!
Finding using the z-table:

Finding using the t-table:

0:00 / 0:00
Example: Confidence Interval for a Proportion
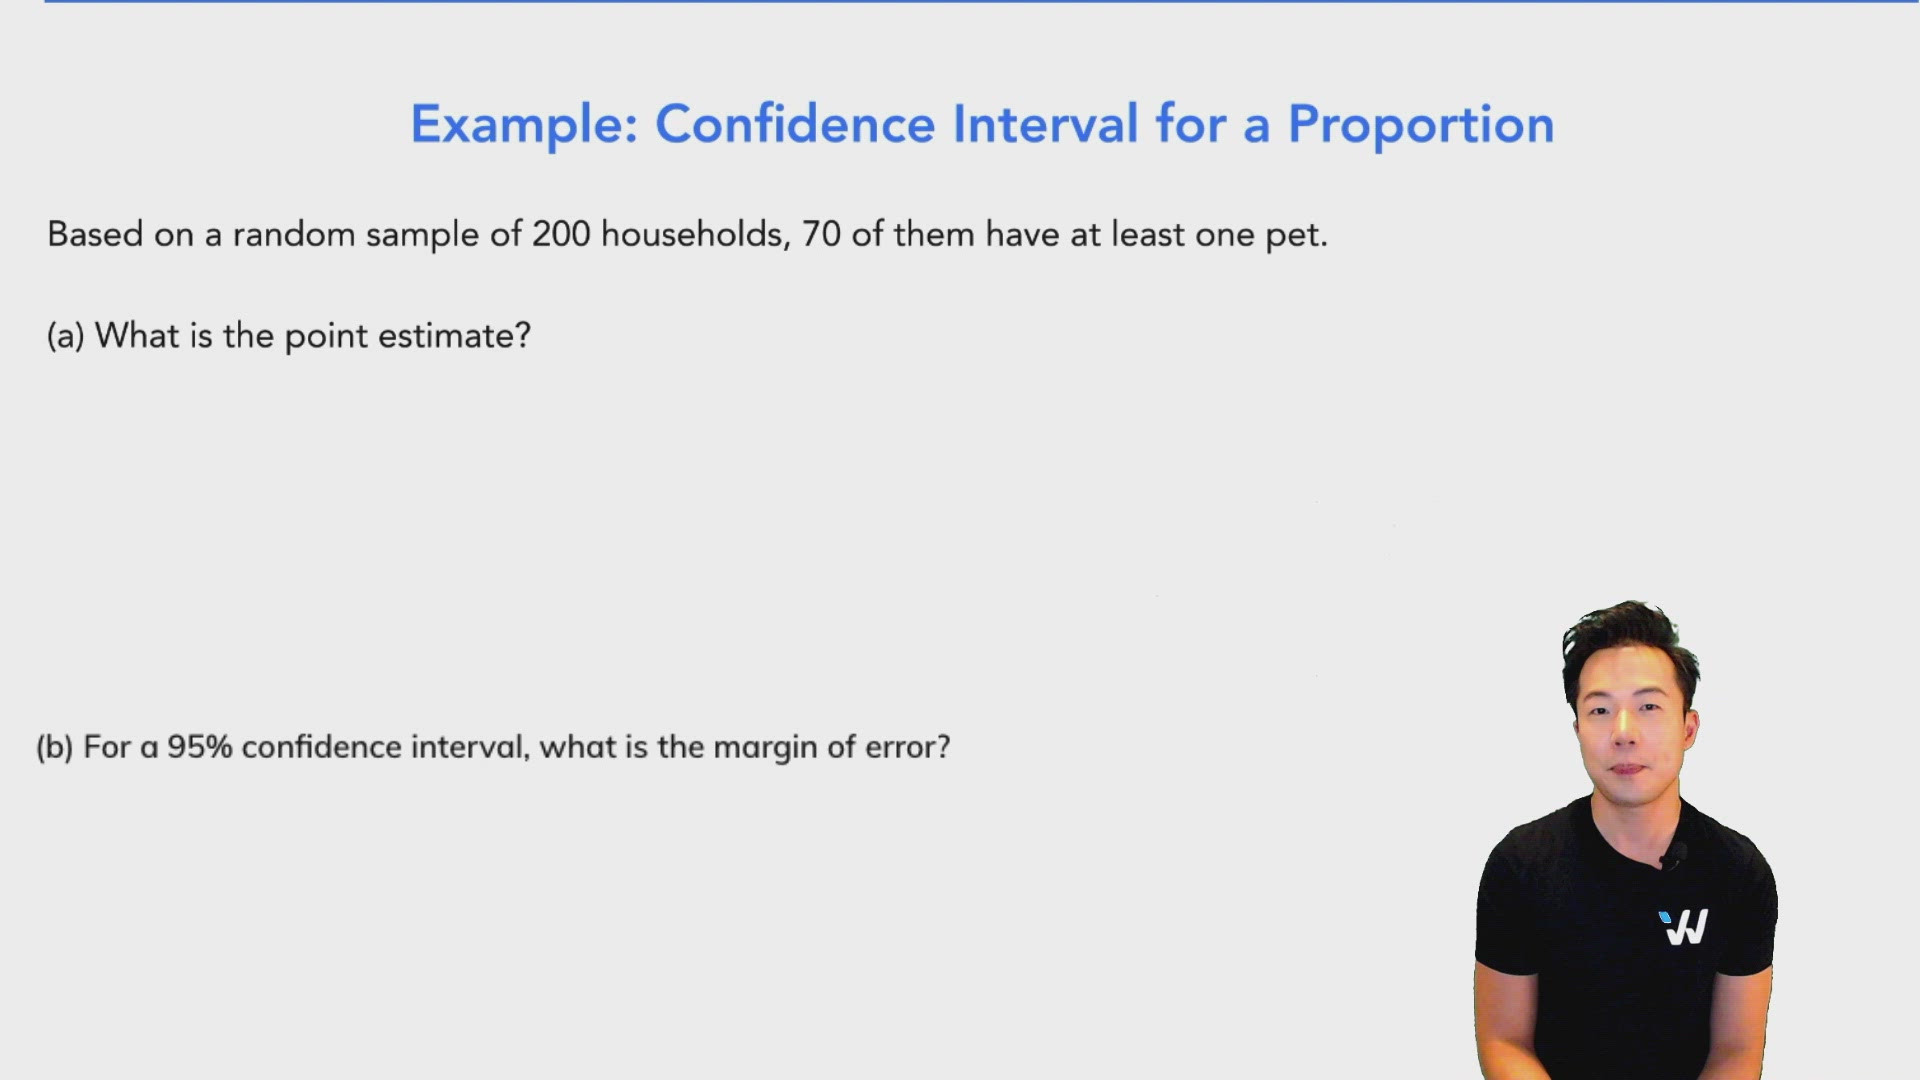
Based on a random sample of 200 households, 70 of them have at least one pet.
(a) What is the point estimate?
The point estimate is the sample statistic. In this case, it is the sample proportion:
(b) For a 95% confidence interval, what is the margin of error?
(c) Construct a 95% confidence interval for households that has pets.
We are 95% confident that between 28.39% and 41.61% of all households have pets.
A random sample of 1000 people in Calgary were asked if they are satisfied with their mobile carriers: “YES or NO?” Results: 535 people said YES.
Construct a 95% confidence interval and interpret it in simple English.