Wize University Statistics Textbook > Scatterplots, Association, and Correlation
Coefficient of Determination
Popular Courses
COMM 214
Concordia University
STAT 151
University of Alberta
Statistics
General Course
Intro to Statistics
University Study Guides
COMM 215
Concordia University
STAT 213
University of Calgary
COMM 191
University of British Columbia
DATASCI 1000A/B
Western University
STA 100
University of California - Davis
Grade 12 Data Management
Ontario High School
STATS 2244A/B
Western University
Intro to Statistics
University Study Guides
STATS 2035
Western University
STAT 161
University of Alberta
QMS 210
Toronto Metropolitan University
STAT 263
Queen's University
STAT*2040
University of Guelph
ENDG 319
University of Calgary
MGCR 271
McGill University
STAT 251
University of British Columbia

0:00 / 0:00
Coefficient of Determination (R Squared)
The coefficient of determination (also known as R Squared) measures how close the data are to the regression model. Loosely, it is also called the "goodness of fit" as it measures how well the regression model fits the data points in a scatterplot.
Example: A low (poor fit):
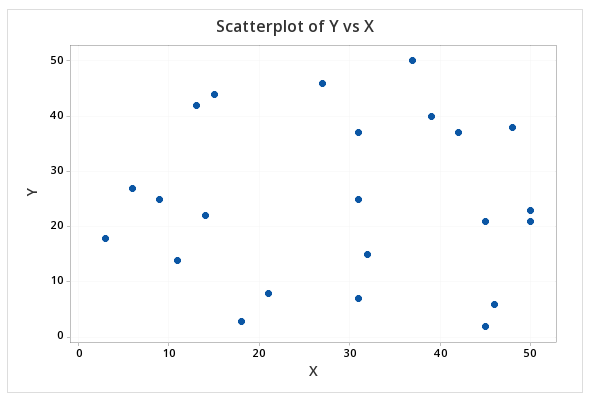
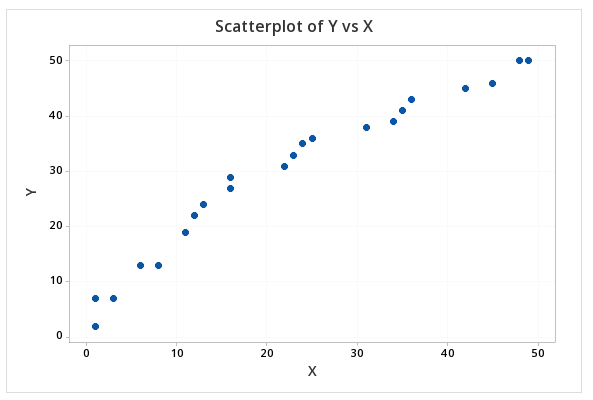
Example: A high (good fit):
Watch Out!
measures how close the data are to the fitted regression model but sometimes a linear model is not the best model! If is low as a linear model, it just means a linear model is a poor fit. Other models include quadratic, cubic model, and multiple regression model.
Portions of information contained in this publication/book are printed with permission of Minitab, LLC. All such material remains the exclusive property and copyright of Minitab, LLC. All rights reserved.
Interpretation of R Squared
= coefficient of determination, where
“____% variation of is explained by ”, where
x: predictor/explanatory/independent variable
y: response/dependent variable
Example
If , that means the explanatory variable explains 78% of the variation in the response variable.
- Where is the remaining 22%? It is left unexplained by this explanatory variable and may be attributed by random errors or could be explained by other explanatory variables.
Watch Out!
(coefficient of determination) may be used to measures fit for any type of regression model - not just linear.
(correlation) may be used to measure the direction and strength of the association between X and Y in linear models only!
Watch Out!
is aways positive unless it is 0, and it cannot be negative. Correlation could be negative, positive, or 0. If then .
Portions of information contained in this publication/book are printed with permission of Minitab, LLC. All such material remains the exclusive property and copyright of Minitab, LLC. All rights reserved.

0:00 / 0:00
Assessing Goodness of Fit
The coefficient of determination could be used to assess "goodness of fit" because it measures of how close the data are to the fitted regression model.
- Keep in mind that not all regression models are linear.
- If a linear model is unable to fit the specific curve that these data follow, then we will obtain a low value.
Linear vs. Quadratic
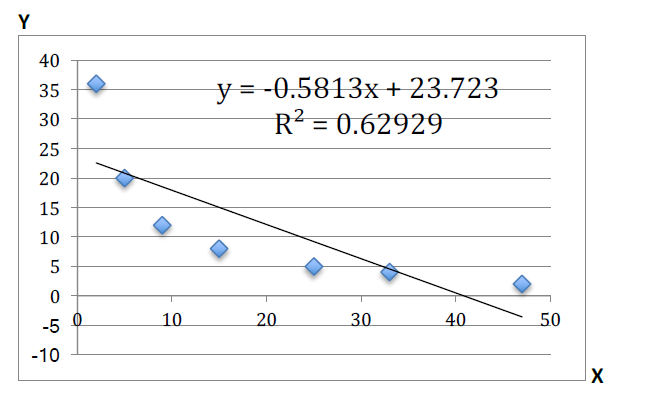
Notice that we are not properly estimating demand, given the data set.
A quadratic model provides a better fit:
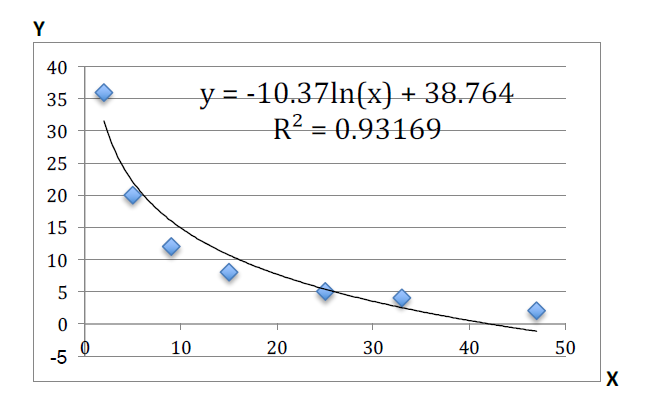
We notice two things when we use a quadratic regression function:
- The drastically improved. This means we have a better estimate of demand at all price levels (within the data range).
- When the price is high, its effect of price on quantity is strong but its effect is diminishing as it does down. (The effect of price on quantity is constant if linear.)
More on Coefficient of Determination
Does a low mean the regression model is bad?
Not always! One explanatory variable in a regression model can only explain so much of the response variable. It doesn't mean that one explanatory variable is insignificant.
You can add more explanatory variables to the regression model, entailing a multiple regression model, which can increase . (Imagine one hockey player trying his best alone in the rink - it doesn't mean he's a bad player; he just needs more help.)
Wize Concept
Inference for Linear Regression and Multiple Regression are typically topics covered in higher level statistics courses.
Does a high mean the regression model is good?
Alas, not always. You still need to look at its residual plot to check for unwanted patterns like unequal spread, skewness, etc. Your regression model should be unbiased.
Wize Concept
See : Residual Plots
Practice: Coefficient of Determination (R Squared)
True or false?
(i) If the coefficient of determination is very strong, then and have a linear relationship with good fit.