Wize University Statistics Textbook > Simple Linear Regression
Solving for the Regression Line
Popular Courses
COMM 214
Concordia University
STAT 151
University of Alberta
AP Statistics Exam Prep Course
AP Exam Prep
Statistics
General Course
Intro to Statistics
University Study Guides
COMM 215
Concordia University
STAT 213
University of Calgary
COMM 191
University of British Columbia
DATASCI 1000A/B
Western University
STA 100
University of California - Davis
Grade 12 Data Management
Ontario High School
High School Statistics
US High School
STATS 2244A/B
Western University
STAT 200
University of British Columbia
Intro to Statistics
University Study Guides
STATS 2035
Western University
STAT 161
University of Alberta
QMS 210
Toronto Metropolitan University
STAT 263
Queen's University
STAT*2040
University of Guelph

0:00 / 0:00
Solving for the Regression Line (r, Sy, Sx Method)

Given a bunch of data coordinates (X,Y), we can generate a scatterplot. Then, we determine the best-fit line to represent the relationship between two quantitative variables: the explanatory variable and the response variable .
The slope , tells us how much changes for every one unit increase in .
Let’s prove this using calculus:
“A unit increase in will change by .”
Wize Concept
The slope and correlation coefficient always have the same sign!
The intercept , tells us the value of when . It is the point where the line crosses the y-axis.

0:00 / 0:00
Example: Solving for the Regression Line (r, Sy, Sx Method)
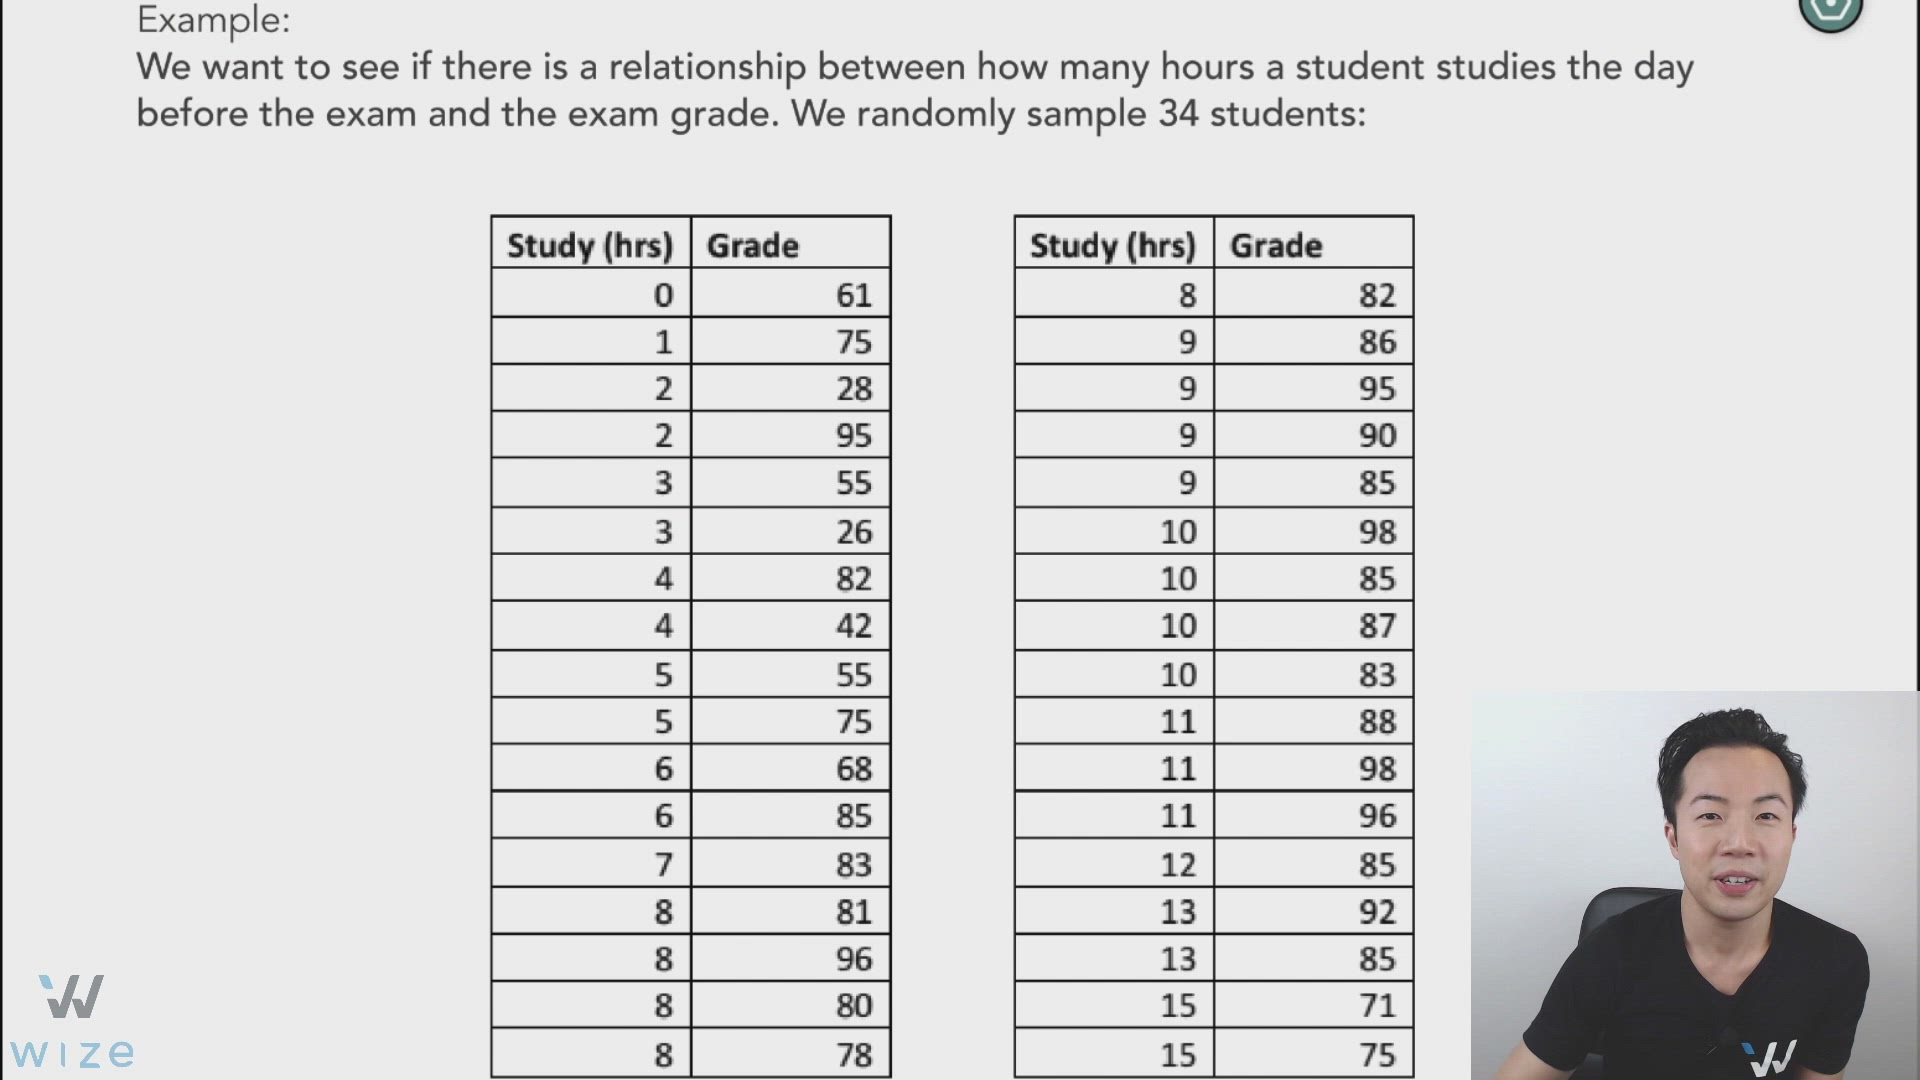
We want to see if there is a relationship between the number of hours a student studies the day before the exam and the exam grade. We randomly sample 34 students:
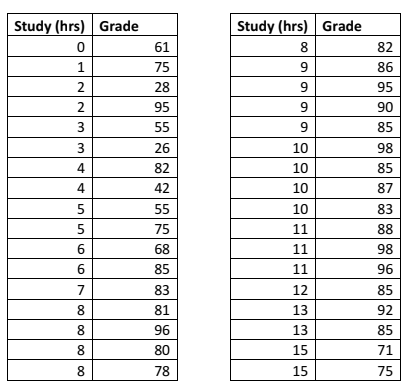
The explanatory variable (X) is:
Study (hours)
The response variable (Y) is:
Grade
Scatterplot
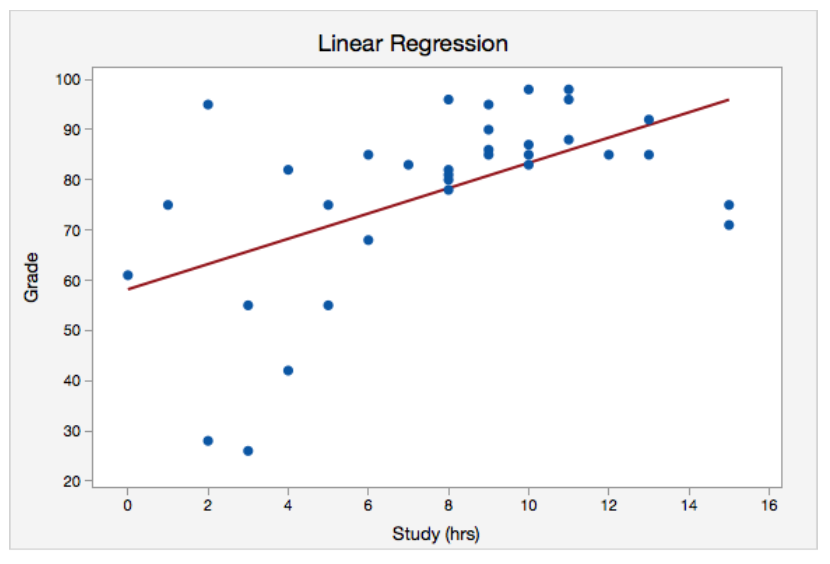
We see a positive correlation. In fact, .
This means that there is a weak, positive correlation between hours studied and exam grade.
What does r2 tell us?
About 29% of exam grade is explained by how many hours you study.
Portions of information contained in this publication/book are printed with permission of Minitab, LLC. All such material remains the exclusive property and copyright of Minitab, LLC. All rights reserved.
Suppose you are given :
Step 1: Find the slope
Step 2: Find the intercept
Step 3: Show the full linear equation
Using the data set below, determine the correlation, slope, and intercept of the least squares regression line.
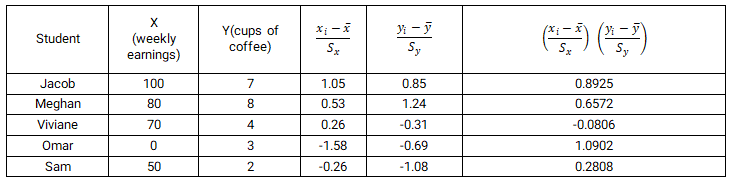
= 60 = 4.8
= 38.08 = 2.59
0:00 / 0:00
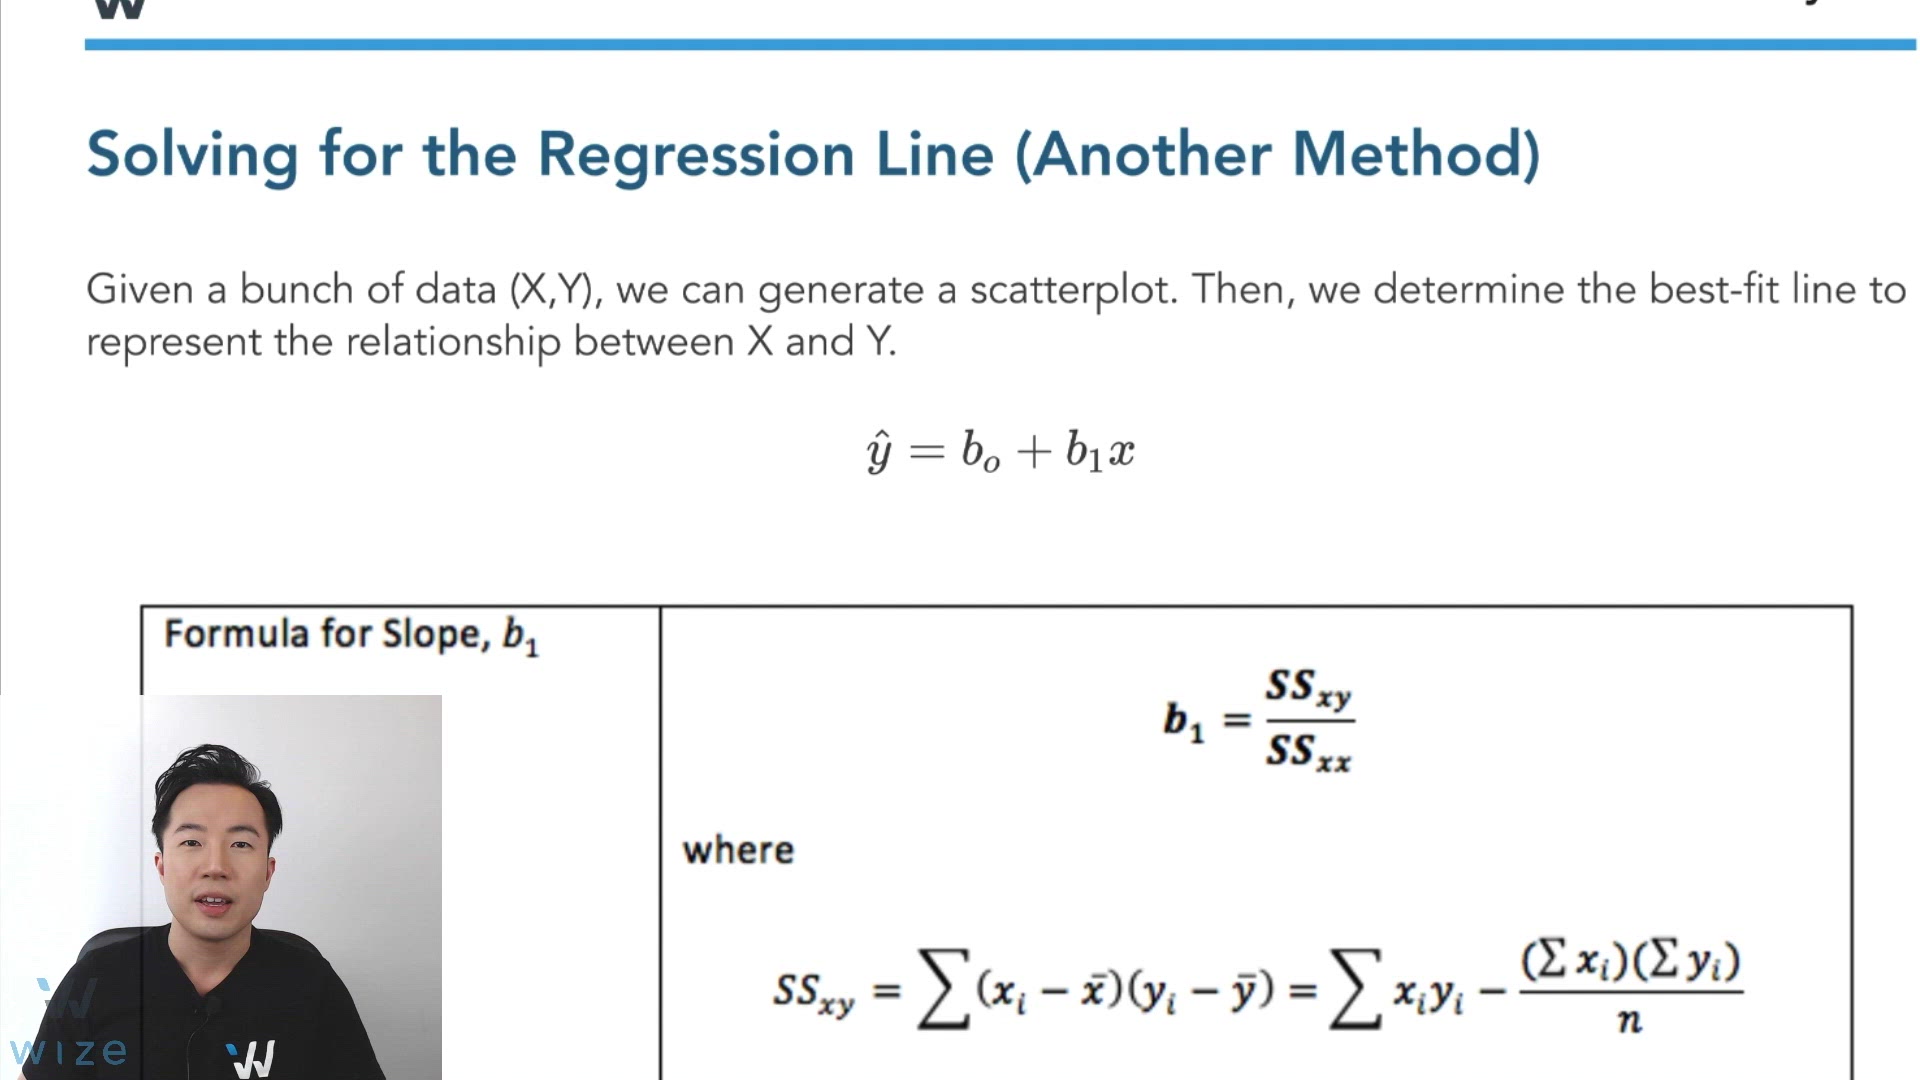
Solving for the Regression Line (Least Squares Method)

Given a bunch of data coordinates (X,Y), we can generate a scatterplot. Then, we determine the best-fit line to represent the relationship between two quantitative variables: the explanatory variable and the response variable .
The slope , tells us how much changes for every one unit increase in .
Let’s prove this using calculus:
“A unit increase in will change by .”
Wize Concept
The slope and correlation coefficient always have the same sign!
The intercept , tells us the value of when . It is the point where the line crosses the y-axis.
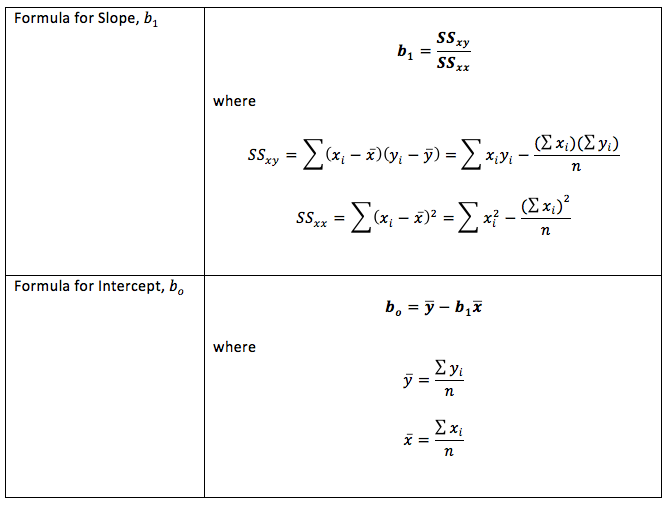
0:00 / 0:00
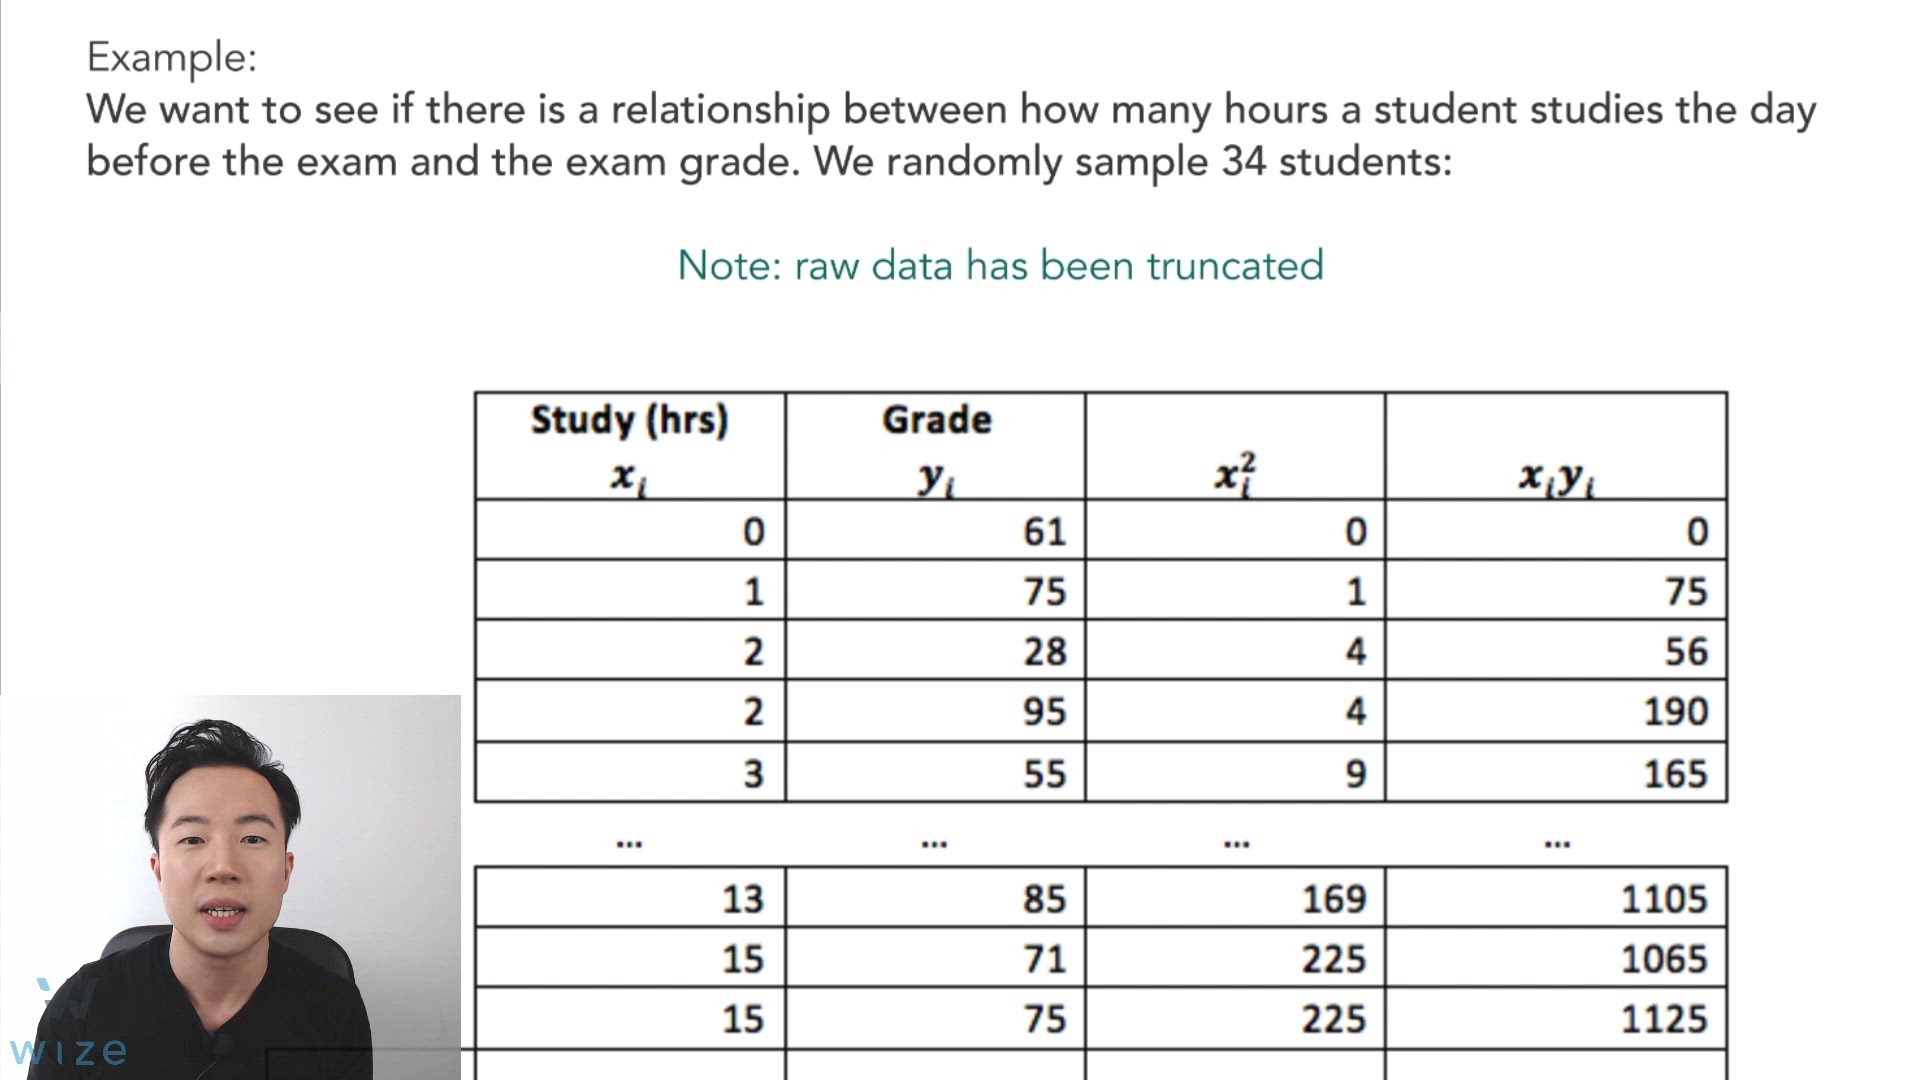
Example: Solving for the Regression Line (Sxy, Sxx Method)
We want to see if there is a relationship between the number of hours a student studies the day before the exam () and the exam grade (). We randomly sample 34 students:
Note: raw data has been truncated
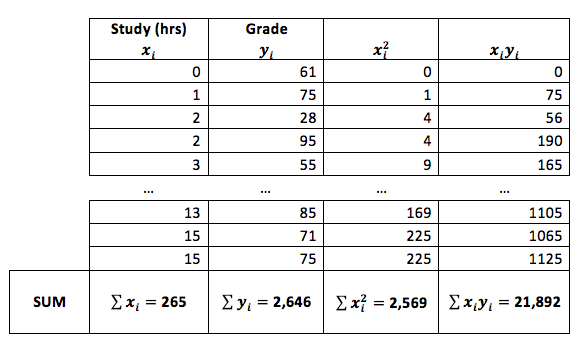
Important:
Scatterplot
Portions of information contained in this publication/book are printed with permission of Minitab, LLC. All such material remains the exclusive property and copyright of Minitab, LLC. All rights reserved.
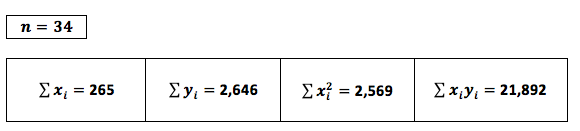
Step 1: Find the slope
Therefore:
Step 2: Find the intercept
Therefore:
Step 3: Show the full linear equation
Using the information provided below, solve for the slope and intercept of the linear regression equation.
Click on 'HINT' if you are stuck!