Create a free account to get started

Unlock full course notes by signing up

  • Video lessons taught by top educators
  • Practice questions with guided solutions
  • Written review notes for reference
  • Expert answers anytime from course tutors

Evolution of Populations

This is a huge section of conservation and evolutionary research that seeks to understand how populations change over time.


Natural selection acts on an individual, but evolution is seen in populations


Evolution and Genetics
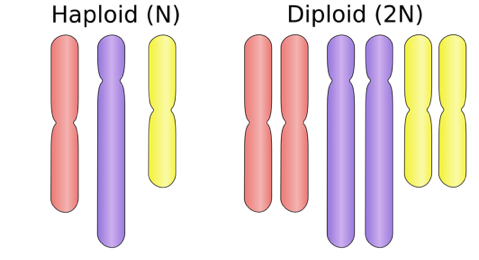

Image illustrating Evolution of Populations

Photo by CNX OpenStax | CC BY

  • Gene: DNA that codes for a trait
  • in diploids there are 2 copies of each gene = 2 alleles
  • Evolution: Change in allele frequencies of a population over time
  • Fitness: How successful an individual's genotype is in the next generation Example: An individual which produces 2 offspring has 2x the fitness of an individual that only produces 1


Drivers of Evolution

  • Natural Selection
  • Directional Selection: one extreme value of a trait is most successful
  • The mean population value shifts, but the variance stays the same
  • Stabilizing Selection: an intermediate trait value is most successful
  • the mean population value stays the same, but the variance decreases
  • Disruptive Selection: the two extreme values of a trait are most successful
  • the mean population value stays the same, but the variance increases


Image illustrating Evolution of Populations

Photo by CNX OpenStax | CC BY


  • Mutation
  • Random change in DNA rarely results in evolution
  • Genetic Drift
  • Change in allele frequency due to chance (stochasticity)
  • exaggerated in small populations
  • Bottleneck Effect: population reduces drastically, leaving only a small subset of the original gene pool
  • Founder Effect: small group breaks off from population and founds a new population with a small subset of the original gene pool
  • Gene Flow
  • Mating occurs between two distinct populations
  • more variation within a population
  • less difference between populations

Create a free account to get started

Unlock full course notes by signing up

  • Video lessons taught by top educators
  • Practice questions with guided solutions
  • Written review notes for reference
  • Expert answers anytime from course tutors

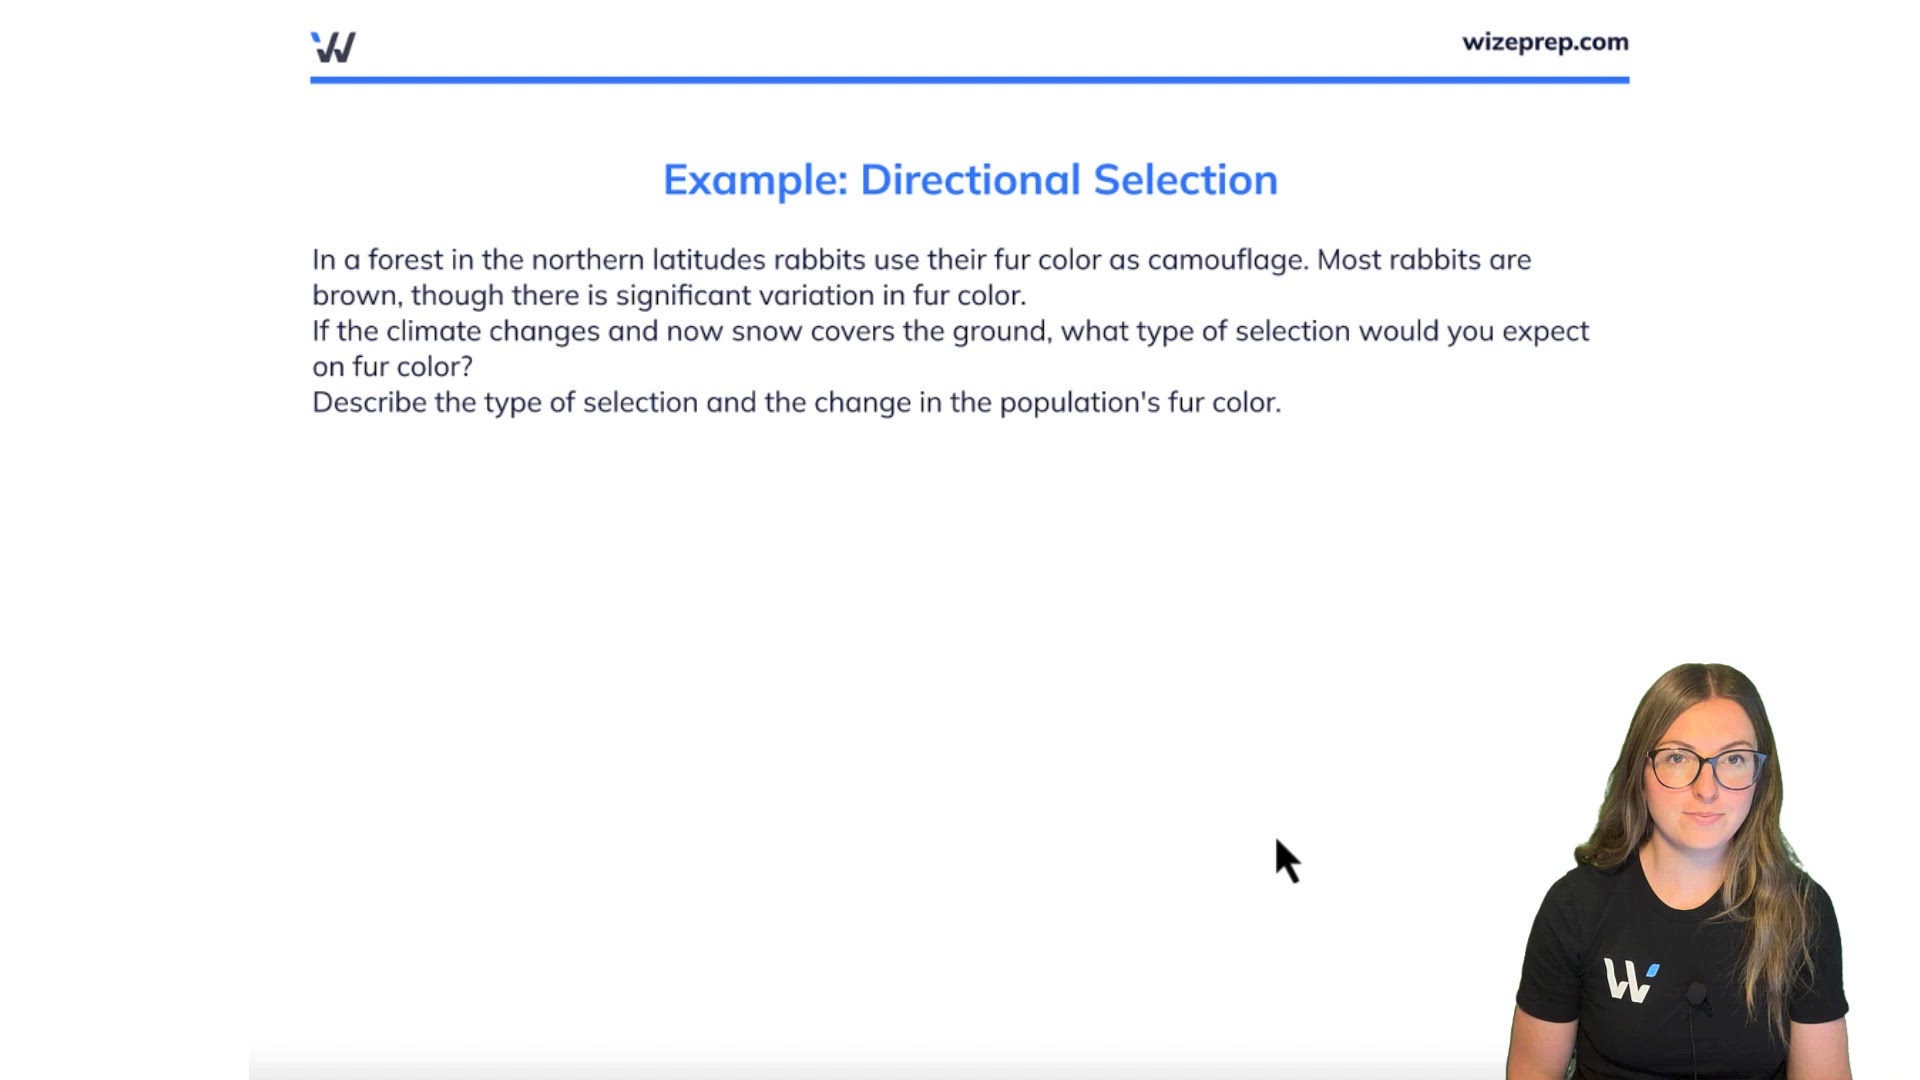
Example: Directional Selection

In a forest in the northern latitudes rabbits use their fur color as camouflage. Most rabbits are brown, though there is significant variation in fur color.

If the climate changes and now snow covers the ground, what type of selection would you expect on fur color?

Describe the type of selection and the change in the population's fur color.


We would expect to see directional selection, since now rabbits with whiter fur will have higher survival in the population. This will shift

the mean fur color of the population towards white.


Practice: Genetics

How many alleles of each gene are present in diploid organisms?

Choose an answer

Create a free account to get started

Unlock full course notes by signing up

  • Video lessons taught by top educators
  • Practice questions with guided solutions
  • Written review notes for reference
  • Expert answers anytime from course tutors

Practice: Drivers of Evolution

Which of the following best describes disruptive selection?

Choose an answer

Create a free account to get started

Unlock full course notes by signing up

  • Video lessons taught by top educators
  • Practice questions with guided solutions
  • Written review notes for reference
  • Expert answers anytime from course tutors

Practice: Drivers of Evolution

Individuals migrating between two distant populations will result in __________.

Choose an answer

Create a free account to get started

Unlock full course notes by signing up

  • Video lessons taught by top educators
  • Practice questions with guided solutions
  • Written review notes for reference
  • Expert answers anytime from course tutors

Create a free account to get started

Unlock full course notes by signing up

  • Video lessons taught by top educators
  • Practice questions with guided solutions
  • Written review notes for reference
  • Expert answers anytime from course tutors

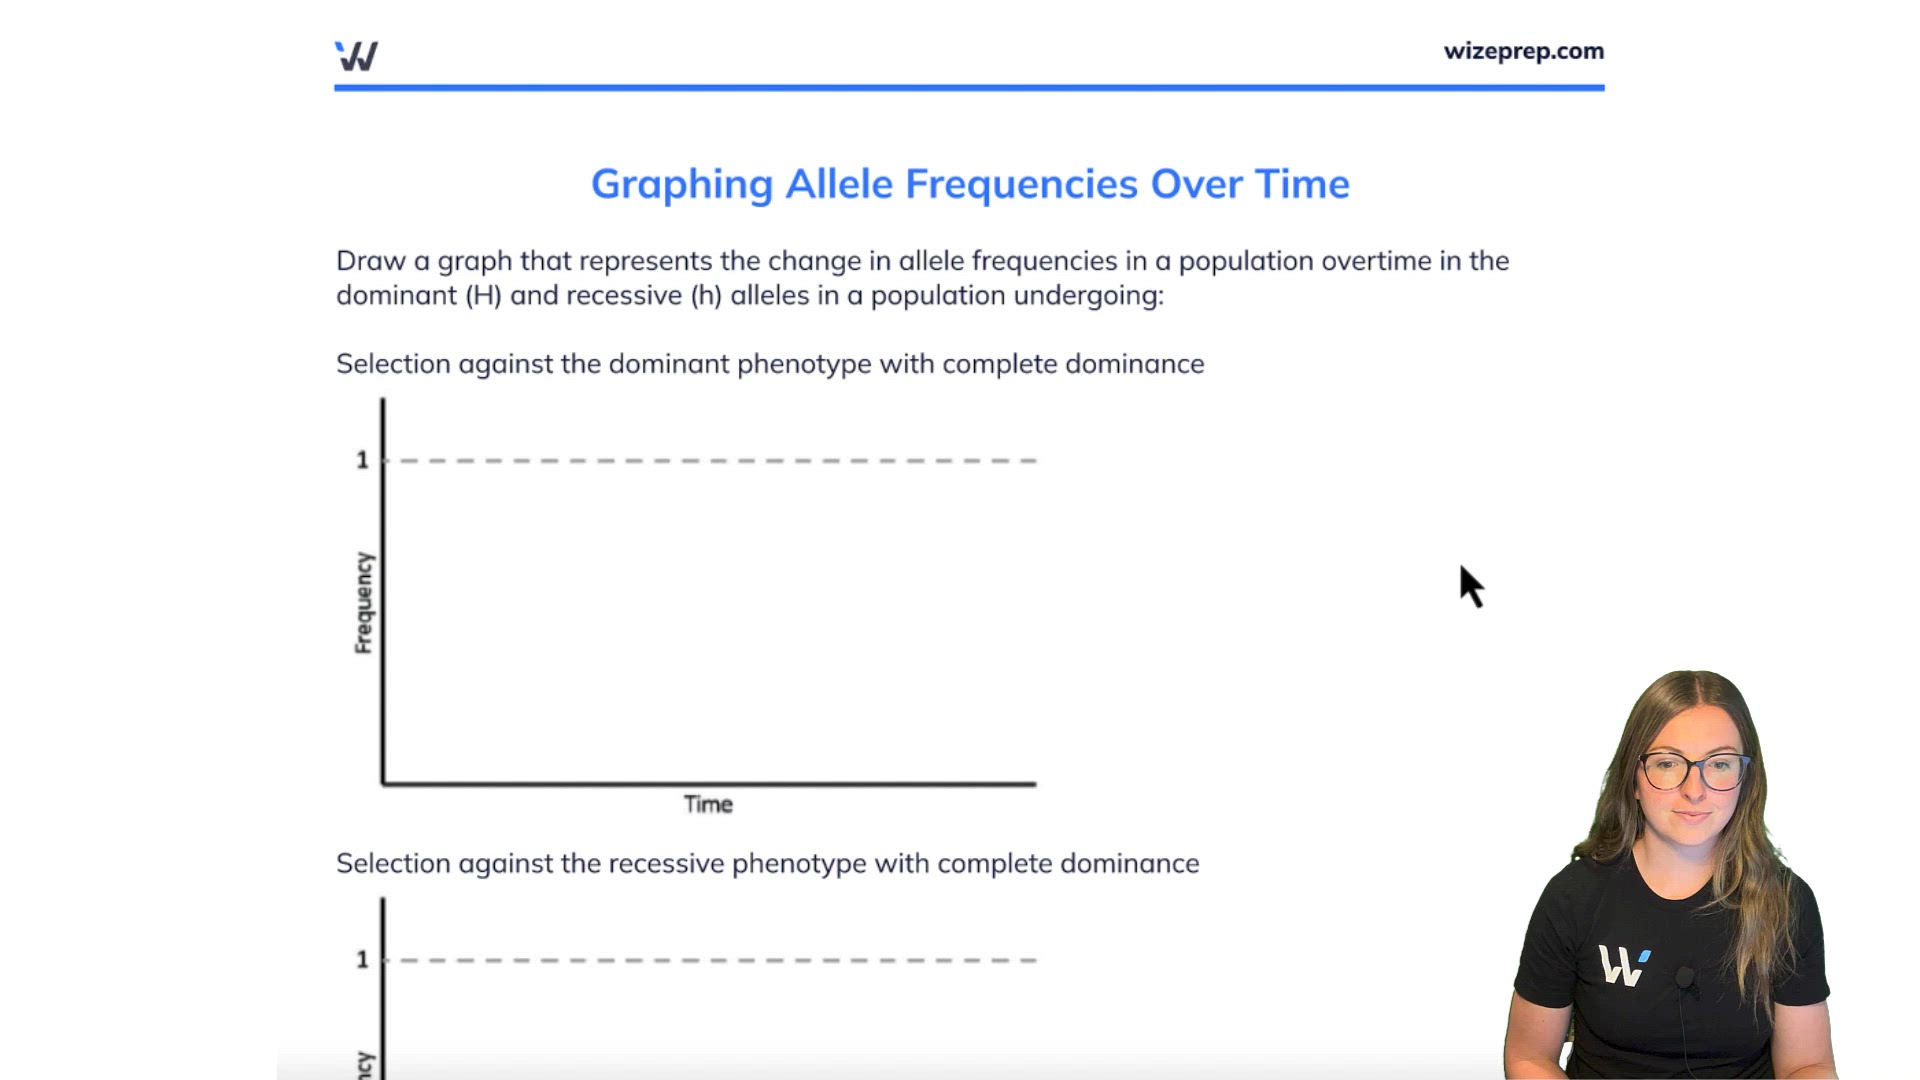
Graphing Allele Frequencies Over Time

Draw a graph that represents the change in allele frequencies in a population overtime in the dominant (H) and recessive (h) alleles in a population undergoing:


Selection against the dominant phenotype with complete dominance
Image illustrating Graphing Allele Frequencies Over Time

Selection against the recessive phenotype with complete dominance

Image illustrating Graphing Allele Frequencies Over Time


Selection favoring heterozygotes with incomplete dominance

Image illustrating Graphing Allele Frequencies Over Time

Selection against heterozygotes where H has an initially high frequency

Image illustrating Graphing Allele Frequencies Over Time


Selection against heterozygotes where h has an initially high frequency

Image illustrating Graphing Allele Frequencies Over Time


You are observing a population of pigs where the B locus controls pig colour with two alleles B1 and B2. There are so many pigs in this population that we can ignore the effects of genetic drift. You note that the starting frequencies of B1 and B2 are 0.7 and 0.3, respectively. Under which situation would B2 reach a frequency of 1 and B1 would disappear completely in the population?

  1. wB1B1 > wB1B2 < wB2B2
  2. wB1B1 < wB1B2 < wB2B2
  3. wB1B1 < wB1B2 > wB2B2
  4. wB1B1 = wB1B2 < wB2B2


Choose an answer

Create a free account to get started

Unlock full course notes by signing up

  • Video lessons taught by top educators
  • Practice questions with guided solutions
  • Written review notes for reference
  • Expert answers anytime from course tutors

Extra Practice