
Normal Distribution
A continuous random variable follows a normal distribution if its probability distribution curve has the following properties:

- It is symmetric about the mean
- It has a bell-shape (mean=median=mode)
- The total area under the curve is equal to 1
- is the same as the area underneath the bell-curve, between the values and
- The horizontal axis measures the possible value of the continuous random variable
- The vertical axis measures the frequency or %’s
Note
We denote this as
Examples
- The height of a randomly selected student from a particular University
- The weight of an apple that is picked from an apple tree
Shape of a Normal Distribution
Two normal distributions can have the same mean but different standard deviations:
Example:

Two normal distributions can have different means and the same standard deviation:
Example:
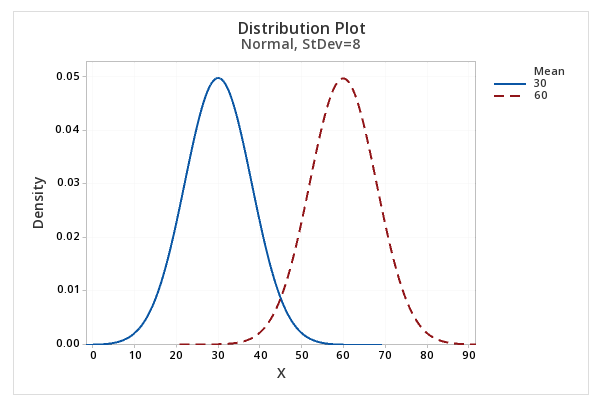
Portions of information contained in this publication/book are printed with permission of Minitab, LLC. All such material remains the exclusive property and copyright of Minitab, LLC. All rights reserved.
Empirical Rule (68 - 95 - 99.7% Rule)
The Empirical Rule states that almost all of the data fall within three standard deviations for a normal distribution.

68% Rule
- The probability that takes on a value between and is approximately 68%
- 68% of the data lies within 1 standard deviation away from the mean
95% Rule
- The probability that takes on a value between and is approximately 95%
- 95% of the data lies within 2 standard deviations away from the mean
99.7% Rule
- The probability that takes on a value between and is approximately 99.7%
- 99.7% of the data lies within 3 standard deviations away from the mean