Practice: Kinematics plots
Related Topics
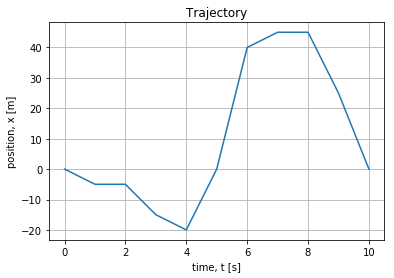
Consider the motion of the following object. The position and time at each second from t=0 to t=10s are shown both in a table and in a graph, below.

Mark Yourself Question
- Grab a piece of paper and try this problem yourself.
- When you're done, check the "I have answered this question" box below.
- View the solution and report whether you got it right or wrong.
a) Plot a velocity against time graph for this motion.