Wize AP Statistics Textbook > Linear Regression
Predictions and Residual Plots
0:00 / 0:00
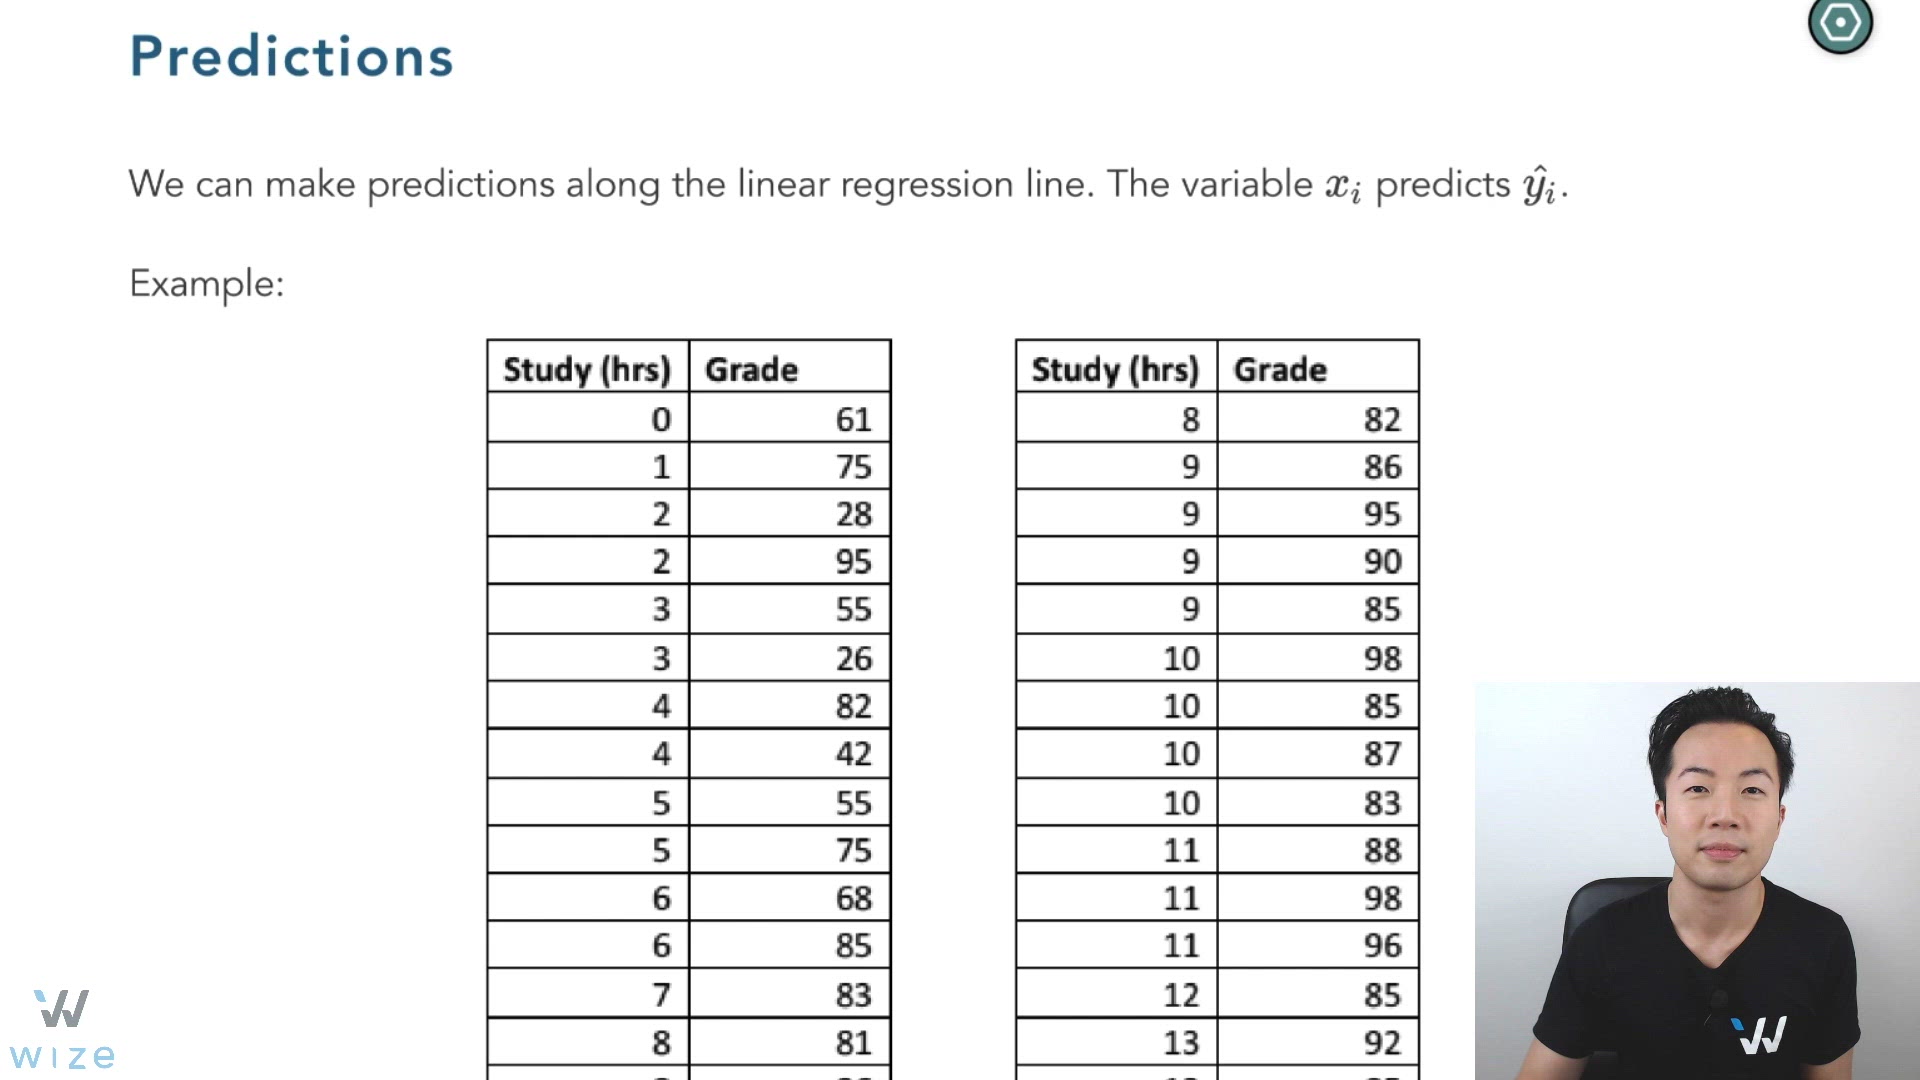
Predictions
When you have the linear regression equation , you can make predictions along it.
The variable predicts . In other words, you plug in to solve for .
Example

Portions of information contained in this publication/book are printed with permission of Minitab, LLC. All such material remains the exclusive property and copyright of Minitab, LLC. All rights reserved.
Example
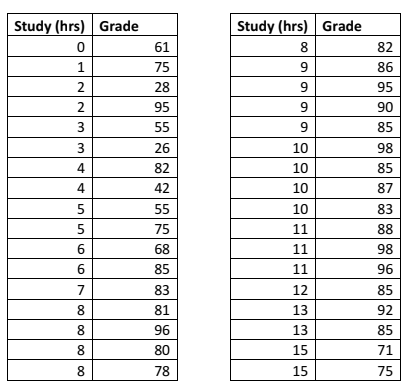
If Phil studied for 12 hours, what is his predicted grade?
Brendan studied for 20 hours. Can we predict he’ll get 109%?
No - we cannot extrapolate! We can only make predictions within the data range to
0:00 / 0:00
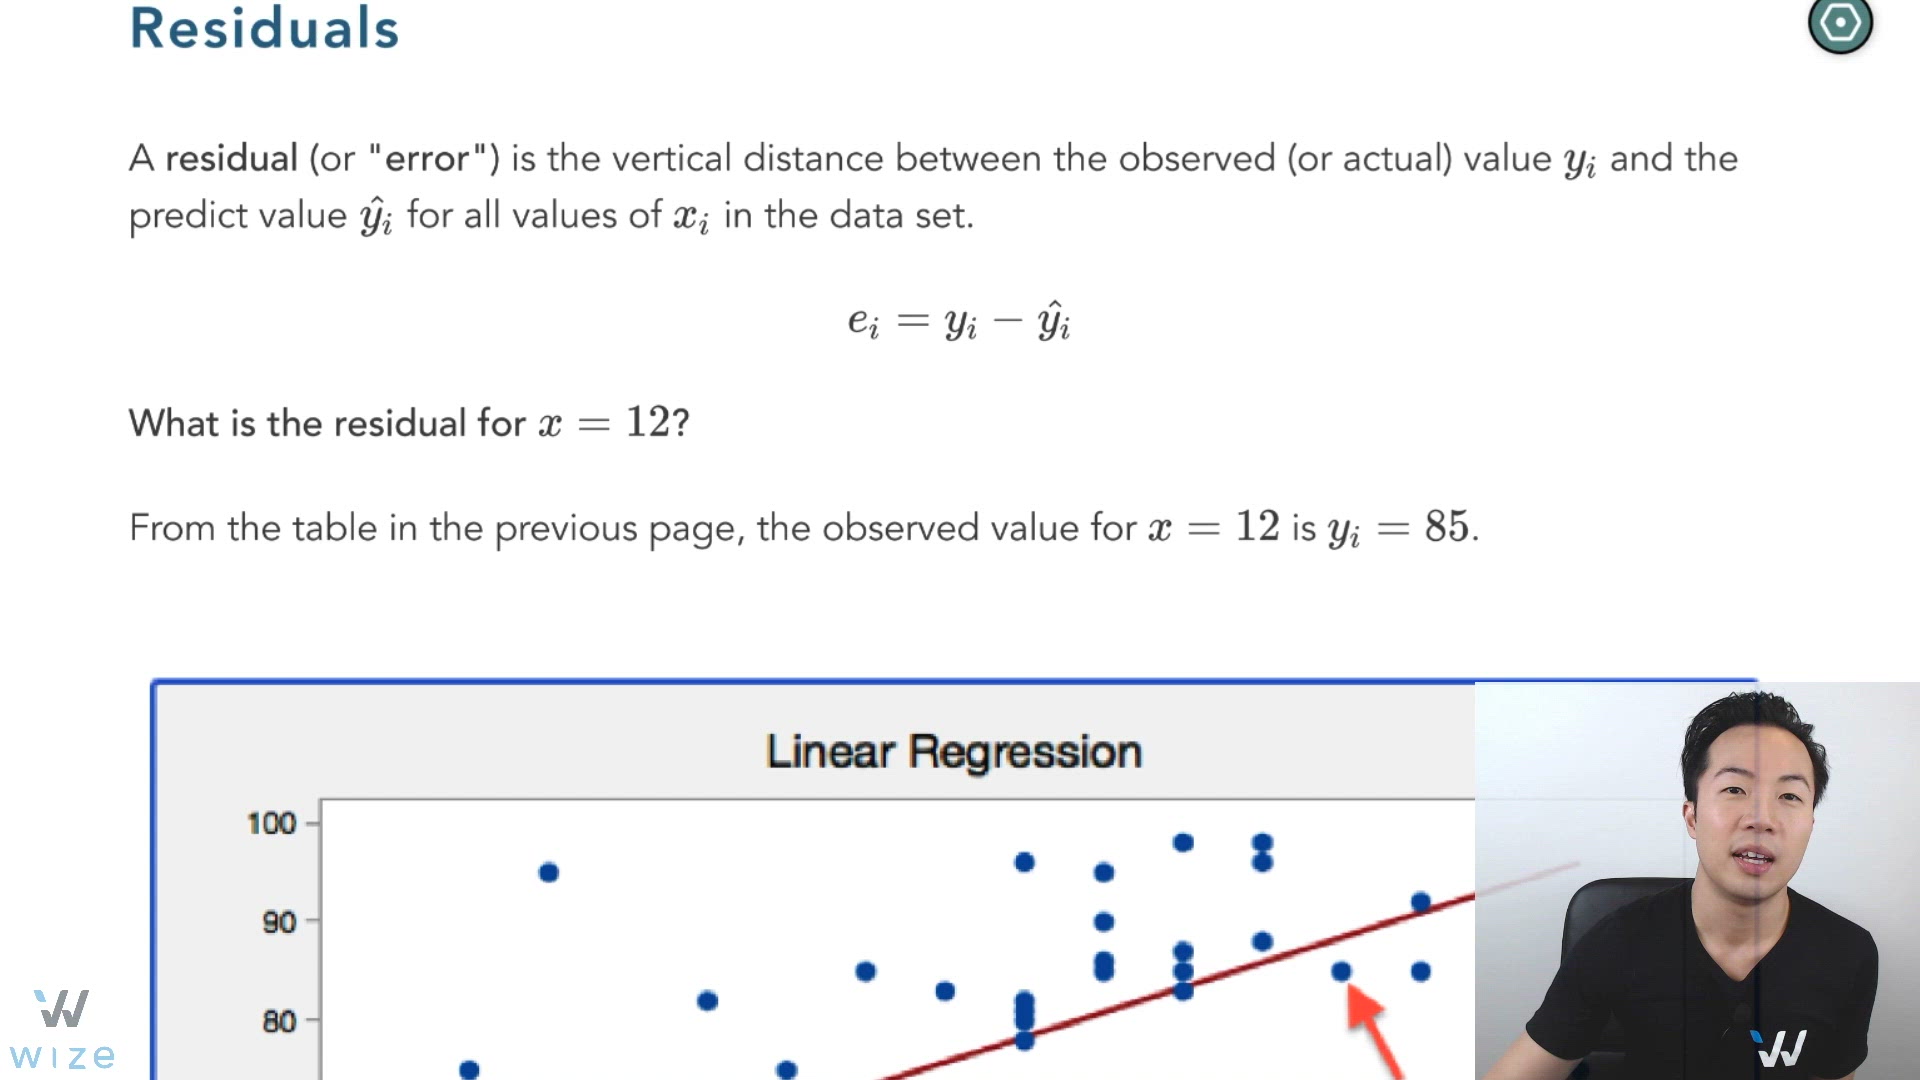
Residuals (Errors)
A residual (or "error") is the vertical distance between the observed value (or actual value) and the predicted value for all values of in the data set.
Wize Concept
An "error" is not a mistake; simply measures how much your prediction has overestimated or underestimated.
If , that means what your predicted equals to the actual value.
Example
What is the residual for ?
From the table in the previous page, the observed value for is .

Since we predicted = 88, the residual for is:
Wize Concept
The sum of all is always 0. The requirement for “best-fit” is that the sum of squared residuals is minimized; hence, why we call it “least squares”.
The equation is used to predict the hourly wage of someone with years of experience.
Elizabeth has 4 years of experience and earns $36 per hour. What is the residual?

0:00 / 0:00
Residual Plots
A residual plot ( on y-axis and on x-axis) helps us assess if the regression model is appropriate or not. It is appropriate if the residual plot shows no pattern.

- In the residual plot (on the right), where the residuals are on the y-axis and plotted against the x-variable for every data point () .
- This residual plot in particular shows a nice linear relationship because the residuals fall randomly above and below the “0” line.
Wize Concept
If the data point lands exactly on the “0” line, it means and . "No error."
Standard Deviation of the Residuals
The standard error of the residuals is a measure of the accuracy of predictions. The smaller the standard error of the estimate is, the more accurate the predictions are.
The reason n − 2 is used (and not n − 1) is that two parameters (i.e. the slope and the intercept) were estimated in order to estimate the sum of squares.

0:00 / 0:00
Regression Diagnostics (L.I.N.E.)
A linear regression model may not always be the most appropriate for the data you have. You should assess the appropriateness of the model by examining your residual plot by checking if any of the conditions are violated.
Common Types of Violated Conditions
Match the residual plots with the conditions violated.
L. Linearity condition violated.
I. Independence condition violated.
N. Normality condition violated (skewed)
E. Equal spread (constant variance) condition violated.

Top row (left to right): L, N
Bottom row (left to right): E, I
Here is a residual plot for selling price (Y) vs. size of a condo in square-feet (X).

Which condition is violated?

0:00 / 0:00
Standard Deviation of the Residuals
The standard error of the residuals (or standard error of the estimate) is a measure of the accuracy of predictions. Specifically, it measures how far the data points are from the best fit regression line overall. In regression, it is also loosely called the overall standard deviation.
The smaller the standard error of the estimate is, the more accurate the predictions are overall.
Linear regression where (one explanatory variable):
Wize Concept
The reason is used (and not ) is that two parameters (i.e. the slope and the intercept) are estimated in order to estimate the sum of squares.
General formula for any value of :
Standard Deviation of the Residuals vs. R Squared
In addition to R Squared, the standard deviation of the residuals is used to access goodness-of-fit in regression analysis.
There is a negative correlation between and :
- As decreases, increases.
- A low tells us that the distances between the data points and the fitted values are small overall, indicating better fit; hence a higher .
- As increases, decreases.
- A high tells us that the distances between the data points and the fitted values are large overall, indicating poorer fit; hence a lower .
Examples
Lower
- Since the overall standard deviation is relatively low, the can make more accurate predictions.
- Residuals will be low for predictions.
Higher

- Since the overall standard deviation is relatively high, the predictions will not be as accurate.
- Residuals will be higher for predictions.
Practice: Standard Deviation of the Residuals
Using the information below, solve for the standard deviation of the residuals .
(simple linear regression)