Dot Plots
The dot plot is a graph that consists of data points that are vertically illustrated with dots. Typically, one dot is one count or frequency. The height of each set of dots indicates how many counts fall within a class interval.
A dot plot may be assessed like a bar graph, histogram, and stem-and-leaf plot because they all have frequency in the y-axis.
Note that bar graphs are used for categorical data and histograms are used for quantitative data. Dot plots may be used for both.
Example
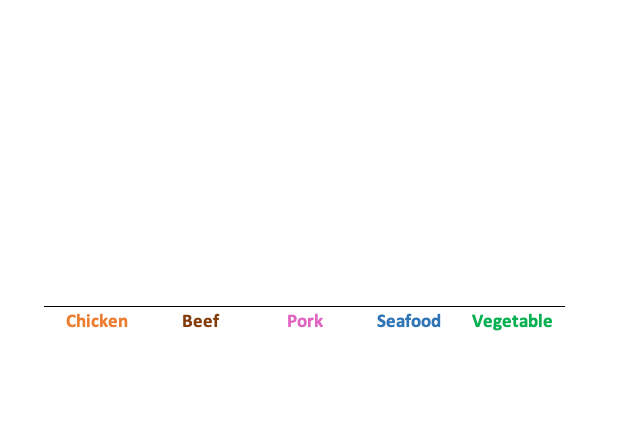
Dot plot with categorical data: favorite ramen flavor.
Chicken = 4 votes
Beef = 6 votes
Pork = 2 votes
Seafood = 8 votes
Vegetable = 5 votes
Example
Dot plot quantitative data: number of refunds made at a store on a given day (random variables X=0,1,2,3...)
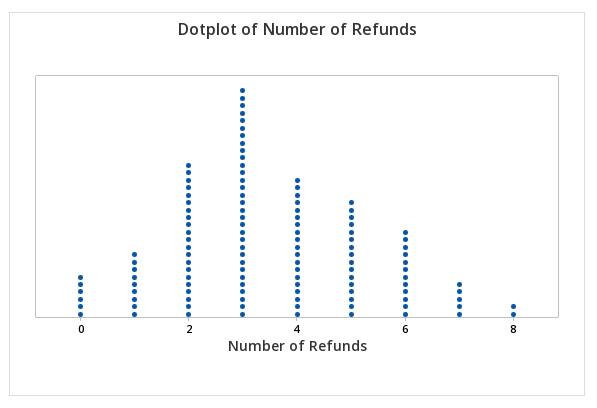
Without access to software, you will need to draw a dot plot by hand so it work best without too many counts in total.
Portions of information contained in this publication/book are printed with permission of Minitab, LLC. All such material remains the exclusive property and copyright of Minitab, LLC. All rights reserved.