Create a free account to get started

Unlock full course notes by signing up

  • Video lessons taught by top educators
  • Practice questions with guided solutions
  • Written review notes for reference
  • Expert answers anytime from course tutors

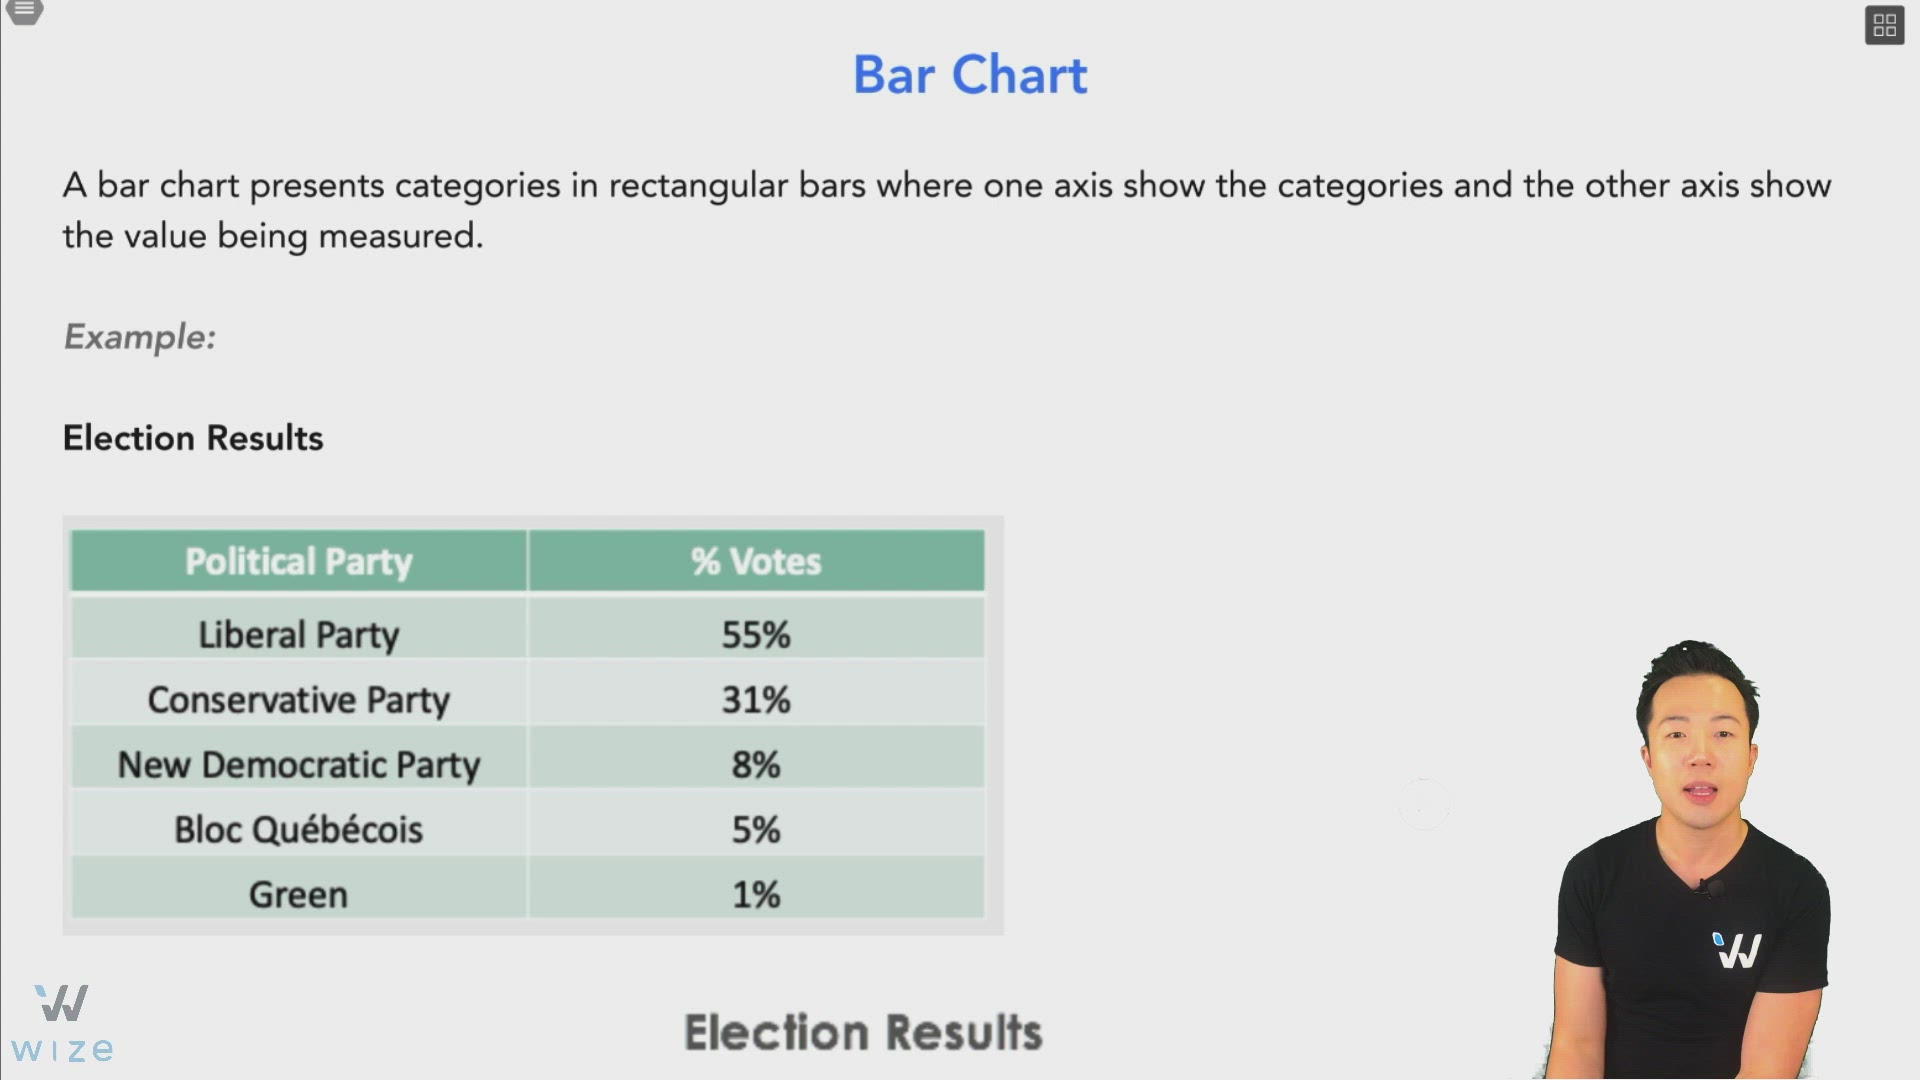
Bar Chart

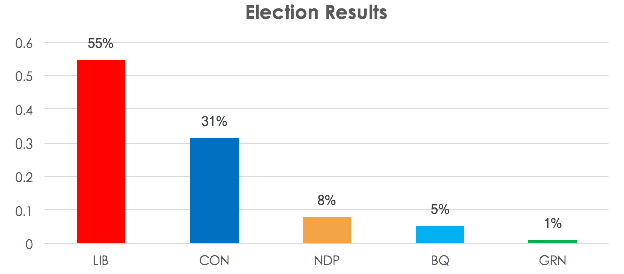
A bar chart presents categories in rectangular bars where one axis show the categories and the other axis show the value being measured.


Example:


Election Results
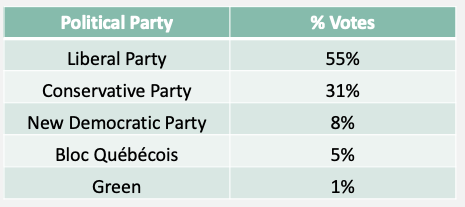

Image illustrating Bar Chart


Image illustrating Bar Chart


A bar chart can be presented vertically or horizontally.
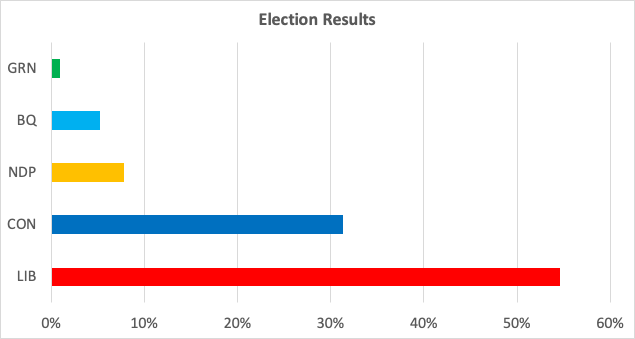

Image illustrating Bar Chart


Since a bar chart displays categorical variables:


1. The order of the bars does not matter.
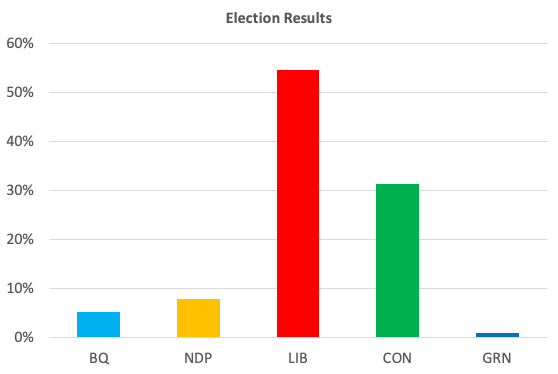

Image illustrating Bar Chart


2. Gaps in between bars are fine in a bar chart.


3. You cannot describe center, skewness, or shape like you could with a histogram, for example, which displays quantitative data.


Practice: Bar Chart

What is wrong with this bar chart?


Illustration for practice question: Practice: Bar Chart


Choose an answer

Create a free account to get started

Unlock full course notes by signing up

  • Video lessons taught by top educators
  • Practice questions with guided solutions
  • Written review notes for reference
  • Expert answers anytime from course tutors