Create a free account to get started

Unlock full course notes by signing up

  • Video lessons taught by top educators
  • Practice questions with guided solutions
  • Written review notes for reference
  • Expert answers anytime from course tutors

Reflections

Reflections

A reflection on a function is when it has been flipped over a vertical or horizontal line like either the x or y-axis.


Example 1


Image illustrating Reflections


Reflections from the equation

We can apply a reflection to a function by multiplying or dividing by -1. The graph will be flipped vertically or horizontally. Sometimes this is described as flipping over the x-axis or y-axis.

y=−f(x)y=f(−x)\begin{aligned} y&=\colorTwo{-}f(x) \\ y&=f(\colorTwo{-}x) \end{aligned}


Vertical Reflection (over x-axis)

  • Multiply the entire function by -1


Horizontal Reflection (over y-axis)

  • Multiplying the input variable by -1


Example 2

For each equation, describe the original function, and the type of reflection.


1. y=−2x2y = -2x^2

  • Function: y=x2y=x^2
  • Reflection: Vertical reflection over the x-axis.


2. y=(−x)3y=(-x)^3

  • Function: y=x3y =x^3
  • Reflection: Horizontal reflection over the y-axis

Create a free account to get started

Unlock full course notes by signing up

  • Video lessons taught by top educators
  • Practice questions with guided solutions
  • Written review notes for reference
  • Expert answers anytime from course tutors

Example: Reflections


Image illustrating Example


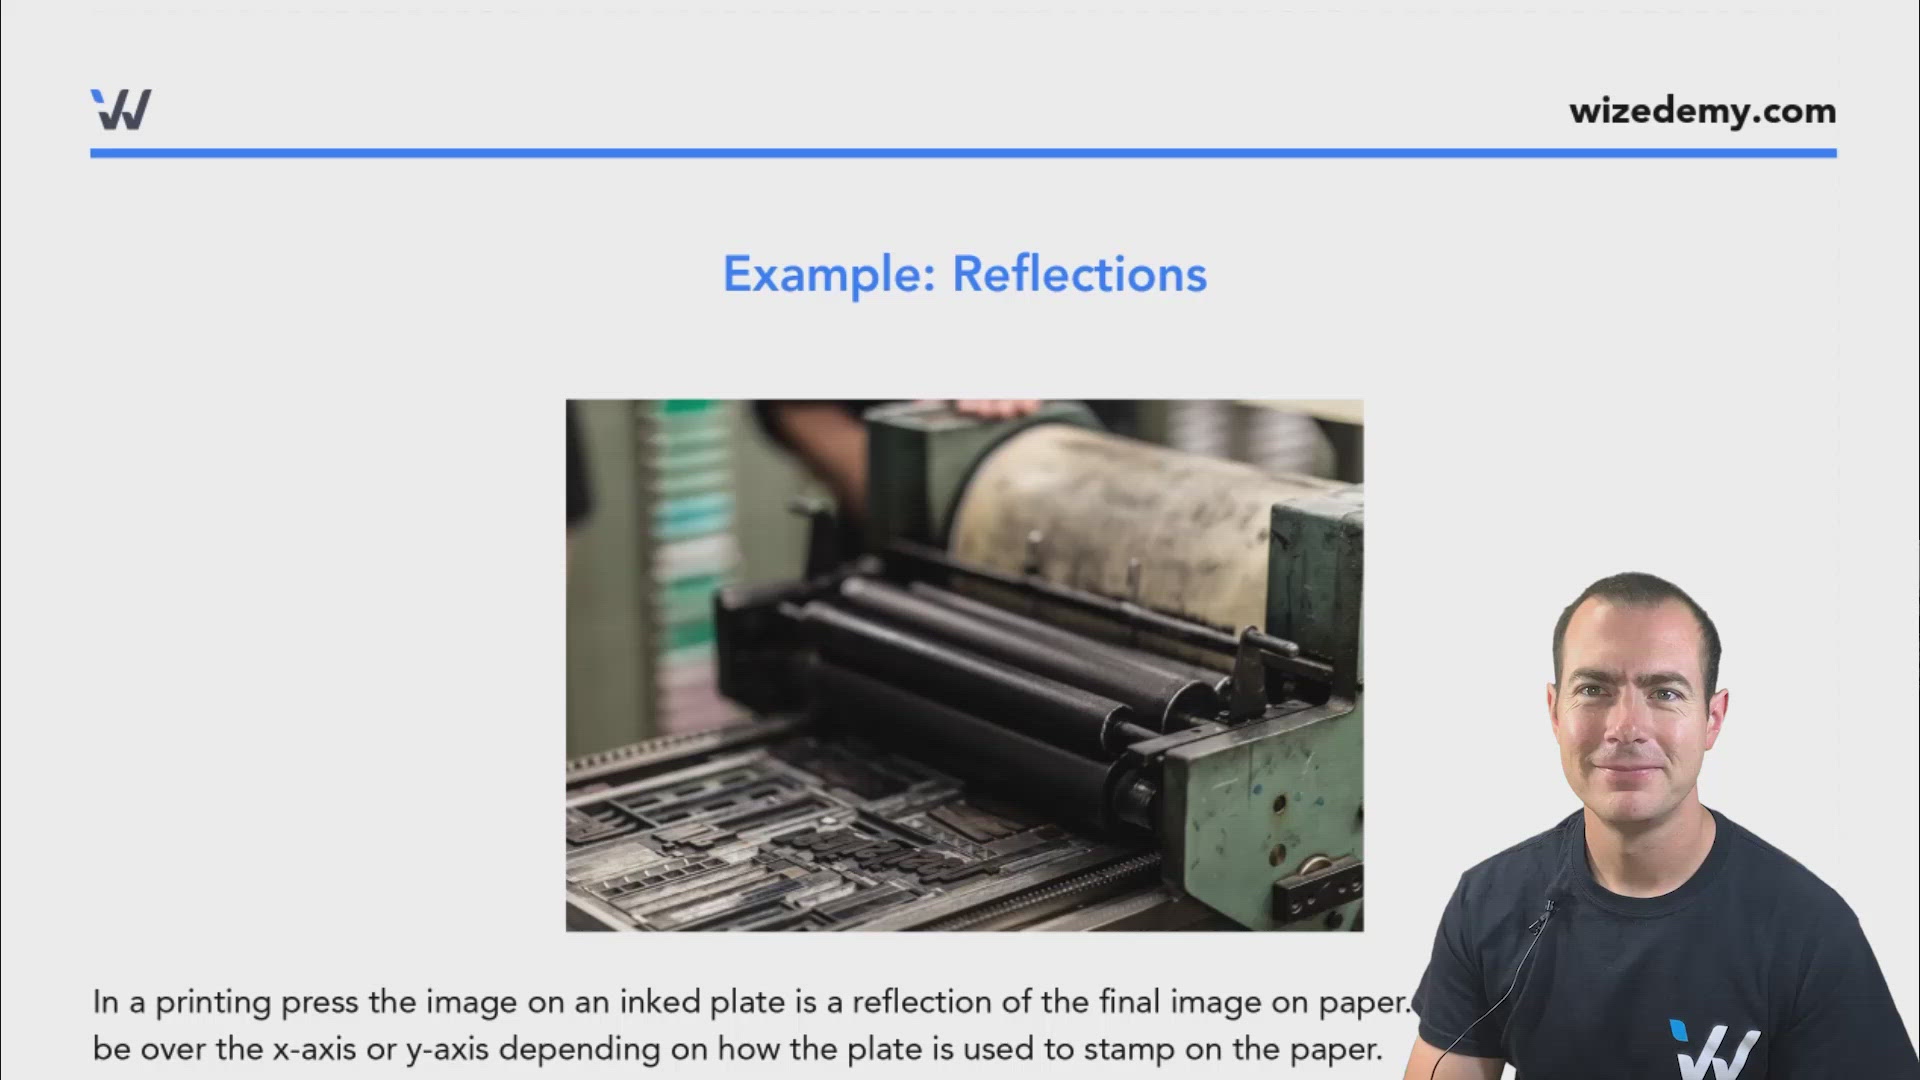
In a printing press the image on an inked plate is a reflection of the final image on paper. This reflection can either be over the x-axis or y-axis depending on how the plate is used to stamp on the paper.


Suppose we have a plate that is horizontal reflection of our final paper over the y-axis.

We want to print the following graph of a function for the financial section.
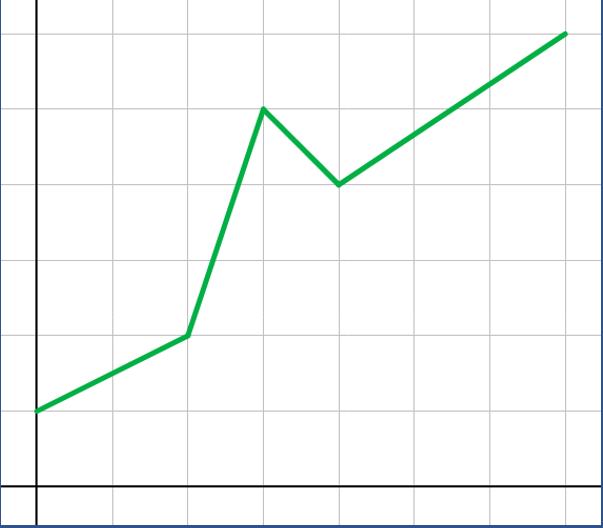

Image illustrating Example


1. What should the graph on the inked plate look like to produce the desired result?
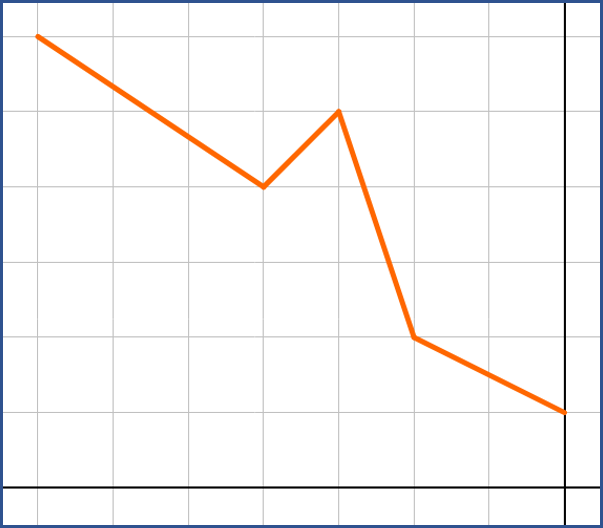

Image illustrating Example


2. Describe how the coordinates of key points on the graph change from the ink plate to the final paper. Use an example help describe the process.


All of the x-values change sign.

A key point on the ink plate like (−3,5)(-3, 5) becomes (3,5)(3, 5) on the final paper.


Practice: Reflections


Illustration for practice question: Practice: Reflections


Given that the original function is f(x)=xf(x) = \sqrt{x}

Fill in the blanks by describing over which axis the function will be reflected.

1. y=−xy = \sqrt{-x}

2. y=−xy = -\sqrt{x}

Your answers

Create a free account to get started

Unlock full course notes by signing up

  • Video lessons taught by top educators
  • Practice questions with guided solutions
  • Written review notes for reference
  • Expert answers anytime from course tutors

Practice: Reflections

The given table represents the inputs and outputs of a given function. If we reflect this function over the y-axis, what will be the new input and output values?

Illustration for practice question: Practice: Reflections


Complete the table with these new values transformed values.


xy
1
00
1
-2

Create a free account to get started

Unlock full course notes by signing up

  • Video lessons taught by top educators
  • Practice questions with guided solutions
  • Written review notes for reference
  • Expert answers anytime from course tutors

Practice: Reflections

The graph of a function f(x)f(x) is given as well as its transformed graph.

Write the equation of the transformed graph.


Illustration for practice question: Practice: Reflections


Your answers

Create a free account to get started

Unlock full course notes by signing up

  • Video lessons taught by top educators
  • Practice questions with guided solutions
  • Written review notes for reference
  • Expert answers anytime from course tutors