Wize University Chemistry Textbook > Equilibrium
Concentration-Time Graphs
Popular Courses
MCAT
General Course
Grade 12 Chemistry
Ontario High School
Grade 12 Chemistry
Canada High School
CHEM 1302A/B
Western University
General Chemistry
University Study Guides
AP Chemistry Exam Prep Course
AP Exam Prep
CHEM 112
Queen's University
CHEM 203
University of Calgary
High School Chemistry
US High School
DAT
General Course
Chemistry
General Course
General Chemistry
University Study Guides
CHEM 1E03
McMaster University
ENGG 204
University of Calgary
Chemistry 12
British Columbia High School
CHM135H1
University of Toronto
CHEM 102
University of Alberta
CHEM 123
University of British Columbia
CHEM 120
McGill University
APSC 132
Queen's University
0:00 / 0:00
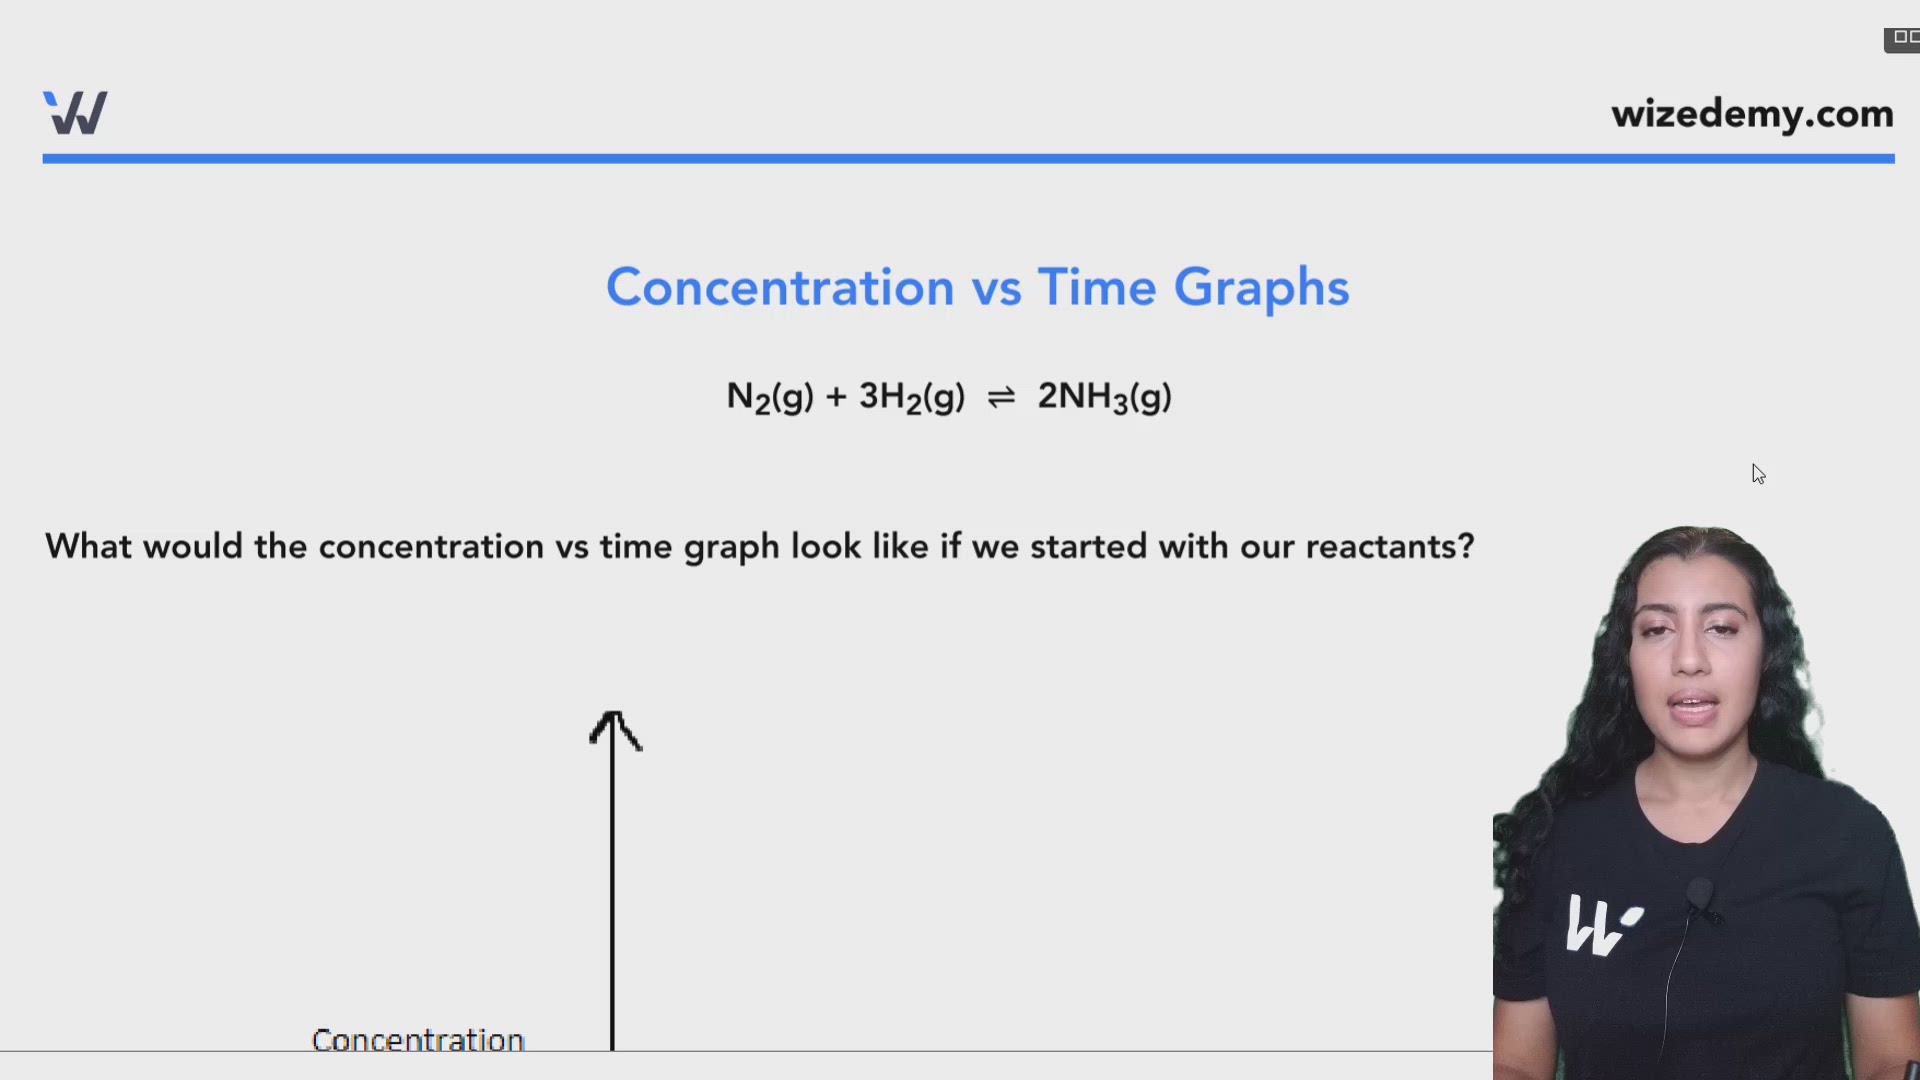
Concentration vs Time Graphs
N2(g) + 3H2(g) ⇌ 2NH3(g)
What would the concentration vs time graph look like if we started with our reactants?
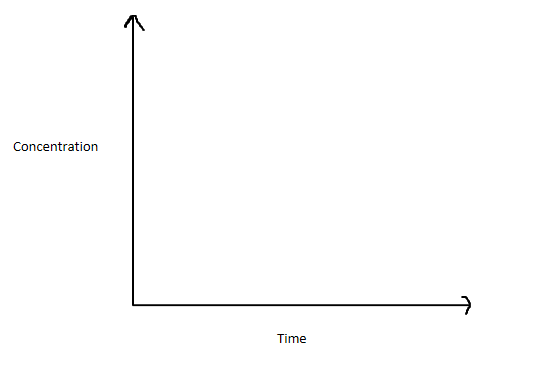
We end up with flat lines because at equilibrium, the relative concentrations of reactants and products don't change!
Practice: Concentration vs Time Graph
Consider the following graph, which was obtained by monitoring the dimerization of NO2 to N2O4.
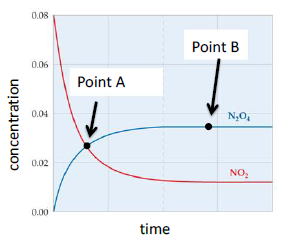
i. [NO2] = [N2O4] at point A;
ii. [NO2] = [N2O4] at point B;
iii. Point A is at equilibrium;
iv. Point B is at equilibrium;
Which of the following statements are true?
Practice: Concentration vs Time Graphs
Use the following reaction to answer the following questions:
2 SO2(g) + O2(g) ⇌ 2 SO3(g)
Below is a concentration-time graph..
