Popular Courses
MCAT
General Course
DAT
General Course
CHEM 121
Simon Fraser University
CHEM 205
University of British Columbia
CHEM 130
University of British Columbia
CHEM 1481
Texas A & M University
CHM 2045
University of Florida
CHEM 1001
Carleton University
CHEM 1P91
Brock University
CHMA11H3
University of Toronto
CHEM 1110
University of Manitoba
CHEM 1300
University of Manitoba
CHEM 151
University of Arizona
CHM 1045
Florida State University
CHEM 124
California Polytechnic State University-San Luis Obispo
NE 121
University of Waterloo
CHEM 161
Rutgers University
CHM220H1
University of Toronto
CHM220H1
University of Toronto
CHEM 1002
Carleton University
0:00 / 0:00
Mass Spectrometry (MS)

Key Definitions
1. Mass/Charge Ratio – Weight of each ion fragment produced by ionization
2. Ion Abundance/Intensity – Amount of each ion produced (%)
3. Base Peak – Tallest peak in spectrum (most stable)
4. Molecular Ion – Peak of original starting compound
5. Isotope Peaks – Ions containing heavier isotopes (12C vs. 13C)
Mass Spectrum of Benzoic Acid

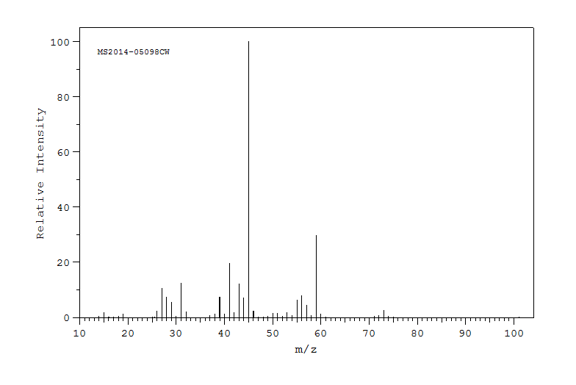
Mass Spectrum of an Alcohol - 2-propanol
Alcohol molecular ions are rarely observed, they rapidily fragment. The oxygen atom will stabilize the radical via resonance.

Isotopes in Mass Spectrometry
Different isotopes of atoms will be seen in a mass spectrum. In some cases, these isotope peaks are fairly large and can serve as diagnostic tools. For example, Boron, Chlorine and Bromine have very distinct isotope patterns.
Carbon: 12C (99%), 13C (1%)
Boron: 10B (20%), 11B (80%)
Chlorine: 35Cl (76%), 37Cl (24%)
Bromine: 79Br (51%), 81Br (49%)
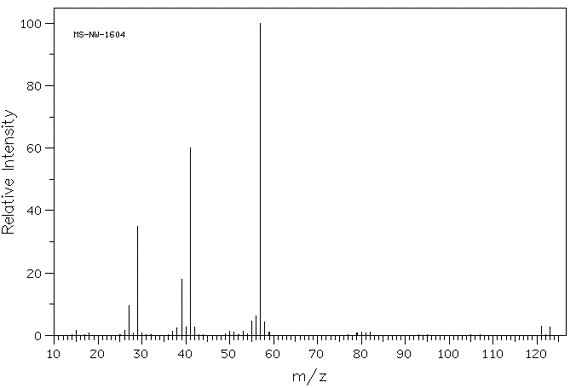
Mass Spectrum of Tert-butyl Bromide

Using MS to determining # of Carbons
We can use MS to estimate the number of carbon atoms in a compound. It uses the ratio of the mass peak for the 13C isotope to the mass peak of the 12C isotope. The equation we use is as follows:
Max # of Carbons = [M+1]+/M+ x 100
We can explore this relationship looking at the MS spectrum of n-hexane:
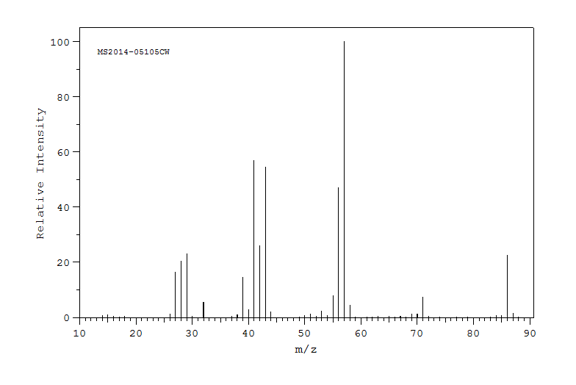
Peak, m/z (% abundance): M+, 86.0 (22.4); [M+1]+, 87.0 (1.4); [M-(C2H5)]+, 57.0 (100); [(M+1)-(C2H5)]+, 58.0 (4.4)

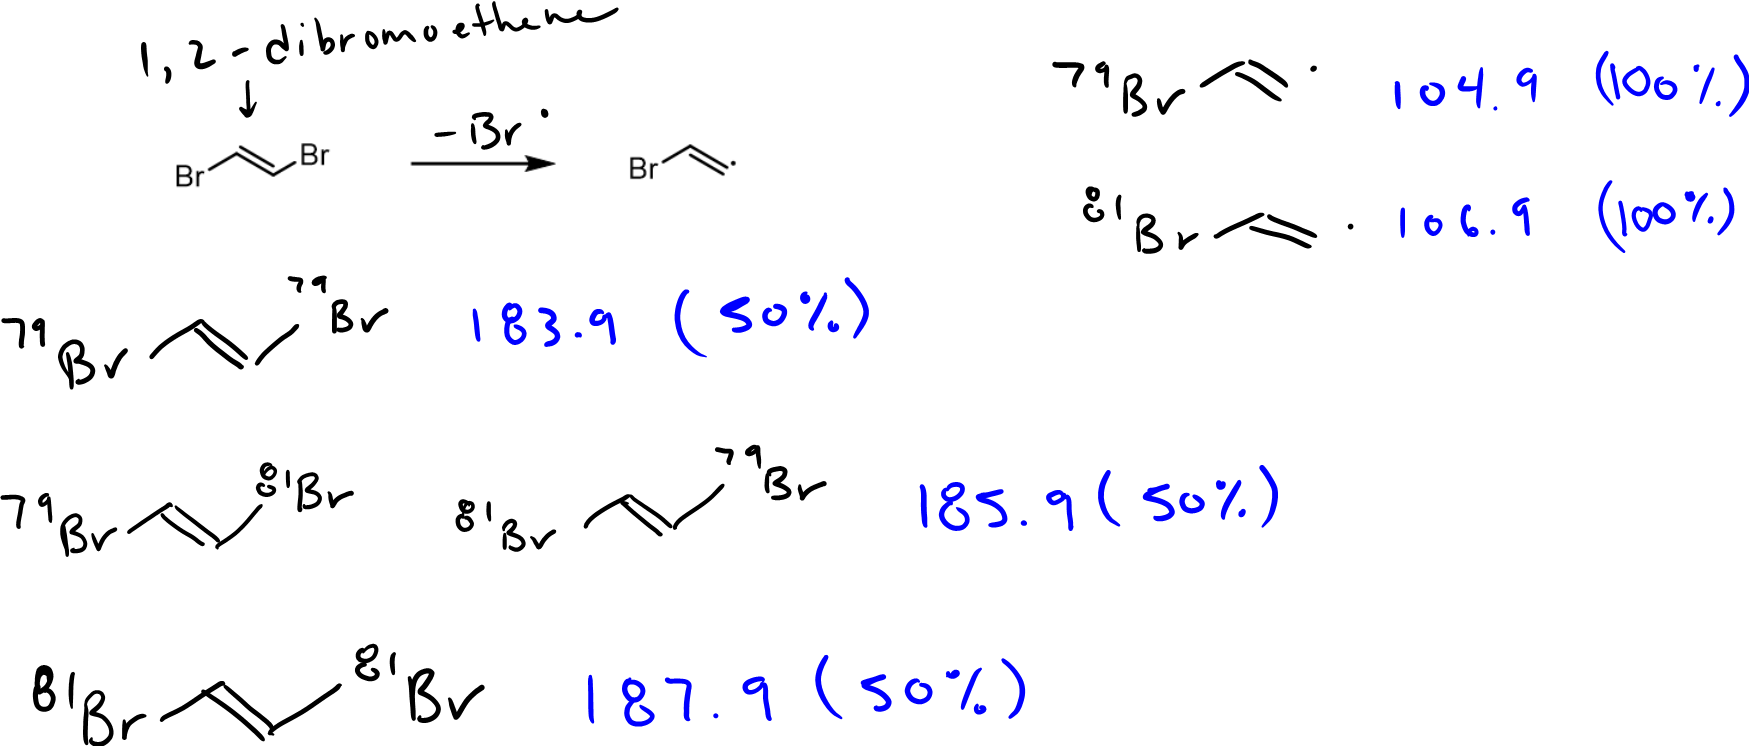
The mass spectrum of (E)-1,2-dibromoethene is shown below. Rationalize the major spectrum peaks at 187.9 (49%), 185.9 (100%), 183.9 (51%), 106.9 (97%), and 104.9 (100%)
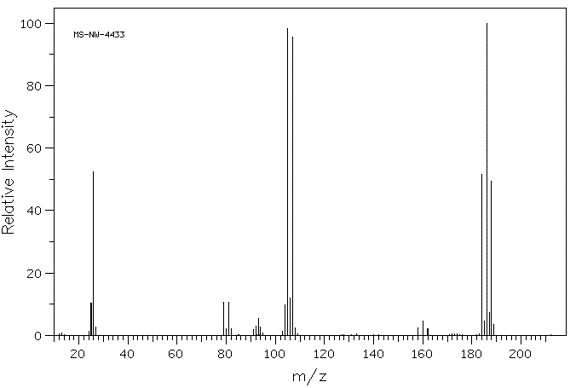
Carbon-halogen bonds will often cleave in a mass spectrometer because the bromide radical is stable. Bromide containing compounds often have a distinct isotope pattern, and multiple bromine atoms further complicate the spectrum:
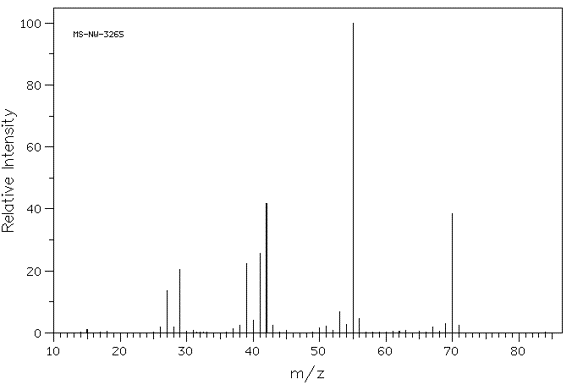
Below is the mass spectrum of 2-pentene. Label the molecular ion and base peak. Provide the structure of the base peak and rationalize its formation.

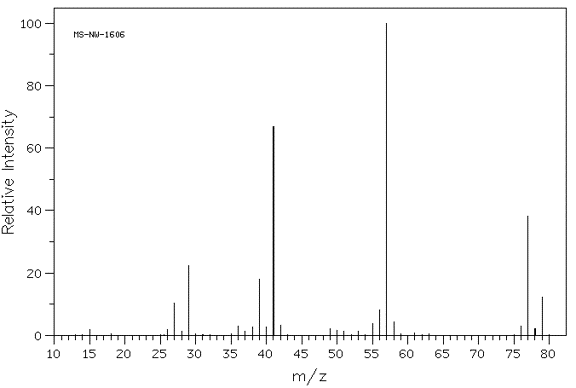
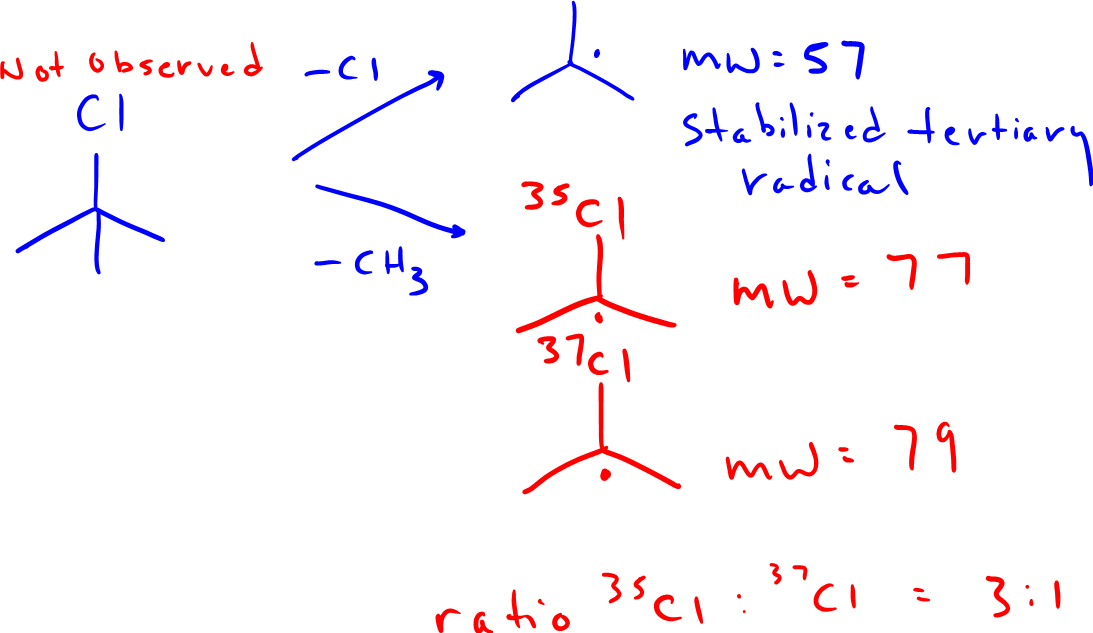
The mass spectrum of tert-butyl chloride (2-chloro-2-methylpropane) does not show it's molecular ion. There is three key diagnostic signals at m/z = 79, 77, and 57. What are the structures of the compounds that give rise to these signals (hint: be specific with any heteroatom isotopes).
The Mass spectrum of 3-bromopentane is shown below. Explain what each of the labeled peaks represents. Note: 81Br and 79Br exist naturally in a 50:50 ratio
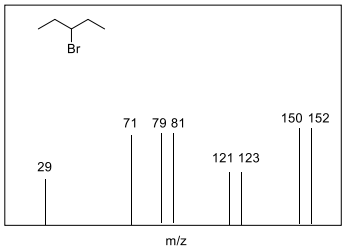
152: 81:
150: 79:
123: 71:
121: 29:

Mark Yourself Question
- Grab a piece of paper and try this problem yourself.
- When you're done, check the "I have answered this question" box below.
- View the solution and report whether you got it right or wrong.
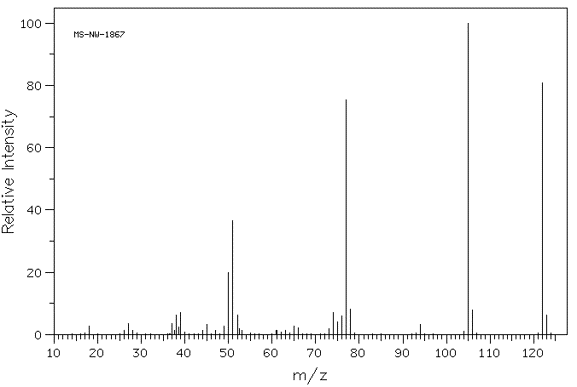
Explain what each peak represents on the following mass spectrum:
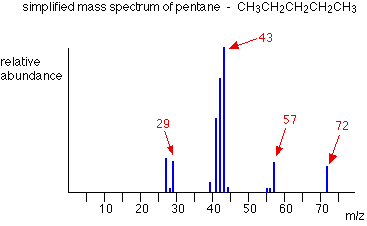
Mark Yourself Question
- Grab a piece of paper and try this problem yourself.
- When you're done, check the "I have answered this question" box below.
- View the solution and report whether you got it right or wrong.
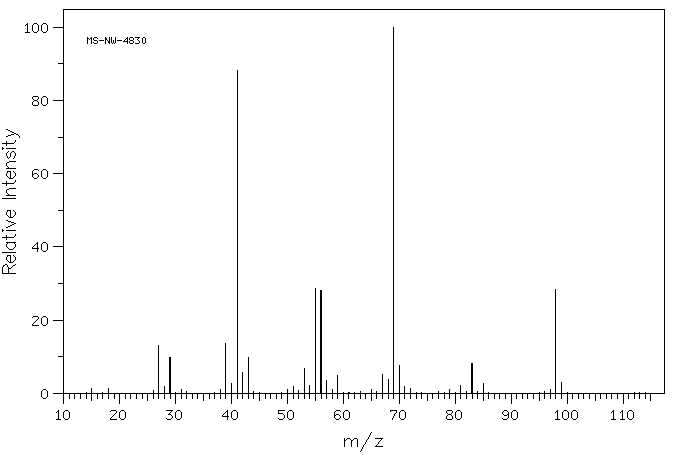
The following is the spectra for 2-methyl-2-hexene. Which fragment of the molecule is represented by the peak at 69m/z?