Wize University Macroeconomics Textbook > Aggregate Expenditure
Aggregate Expenditure Graph
Popular Courses
ECON 203
Concordia University
Macroeconomics
University Study Guides
ECONOMIC 1022A/B
Western University
Macroeconomics
General Course
ECON 102
University of British Columbia
ECON*1100
University of Guelph
Macroeconomics
University Study Guides
ECON 102
University of Alberta
ECO102H1
University of Toronto
ECO 1102
University of Ottawa
ECON 209
McGill University
ECON 1BB3
McMaster University
ECON 112
Queen's University
ECON 295
McGill University
ECON 110
Queen's University
ECON 1102
Dalhousie University
ECON 1002
Carleton University
ECON 1BA3
McMaster University
ECON 330
McGill University
EC 202
Michigan State University
0:00 / 0:00
Aggregate Expenditure Graph
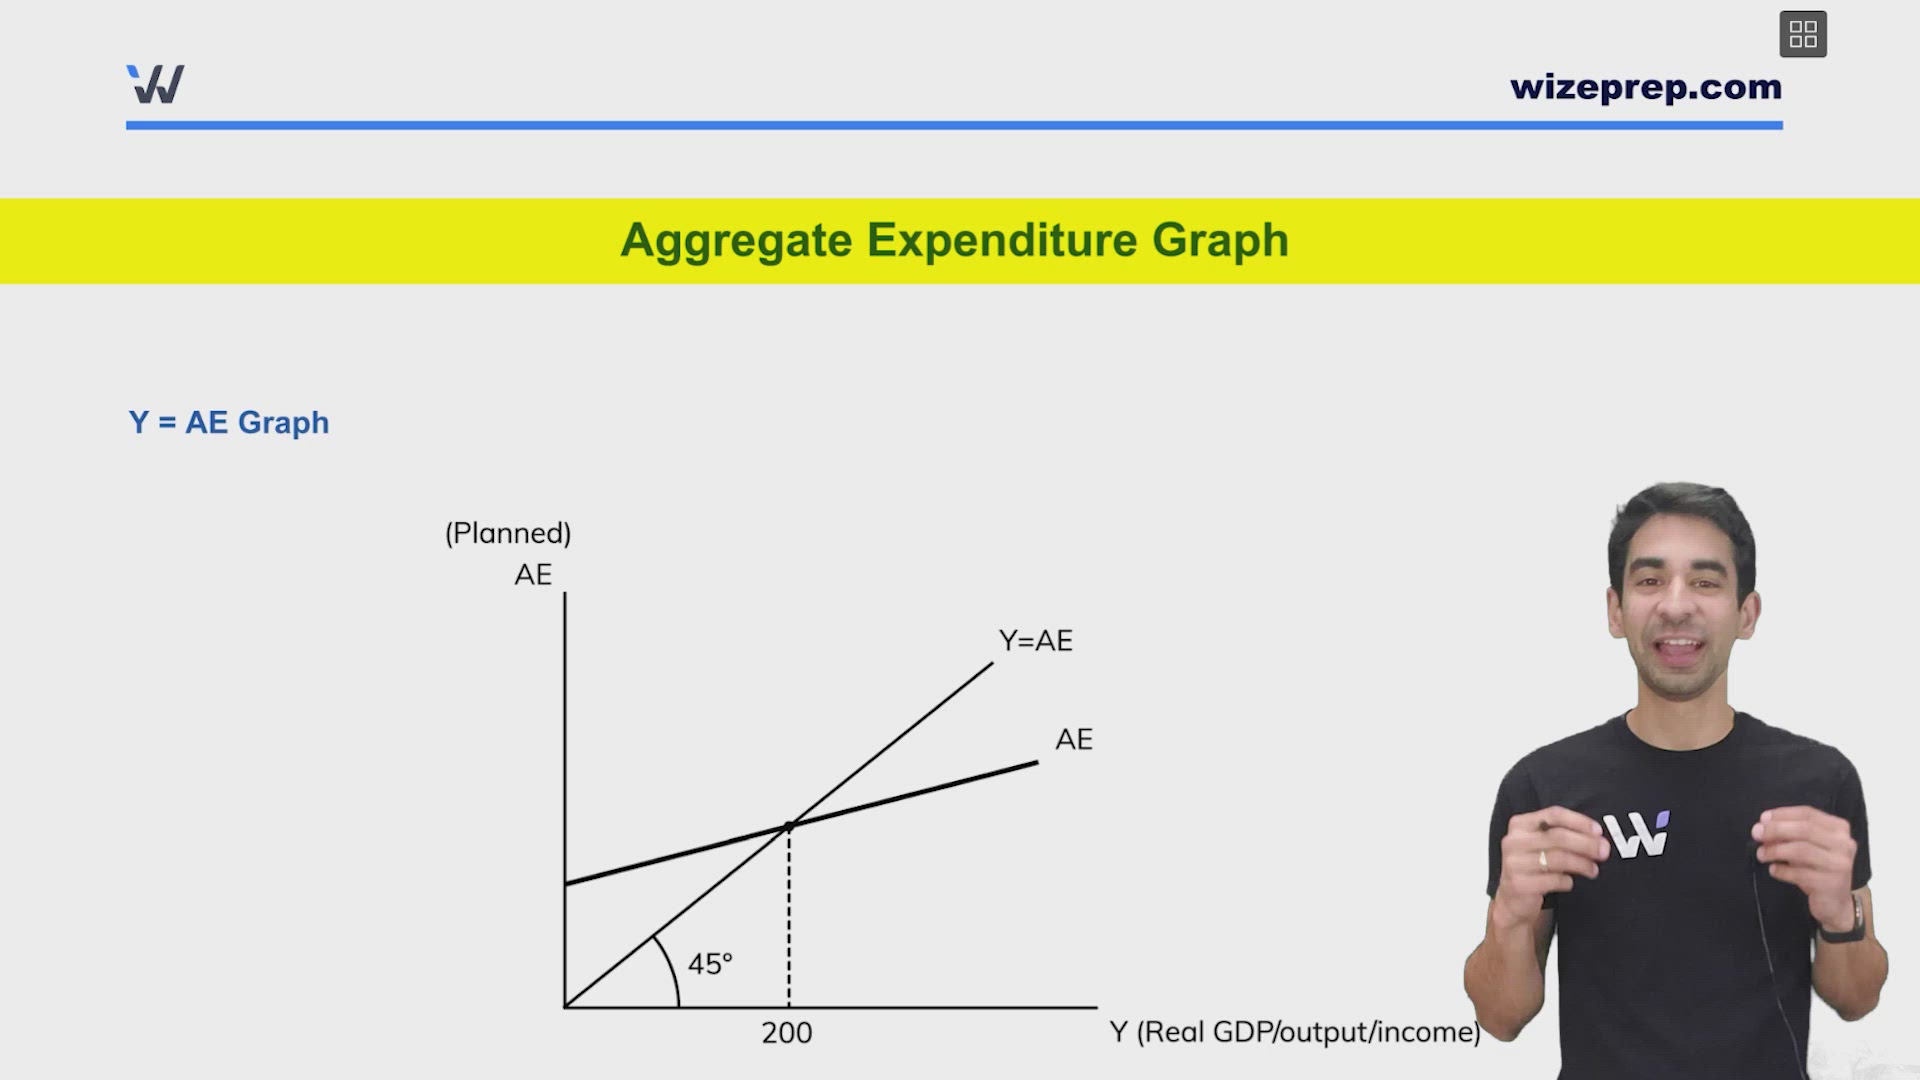
Y = AE Graph

- The 45 degree line is not a real line. It is just a hypothetical line that shows us all the points where real output (Y) = planned aggregate expenditure (AE).
- The aggregate expenditure is a real line. It shows us how much we are planning to spend this year at different income levels.
- The point where the AE line intersects with the 45 degree line is our equilibrium output/income/real GDP (Y).
AD/AS Graph
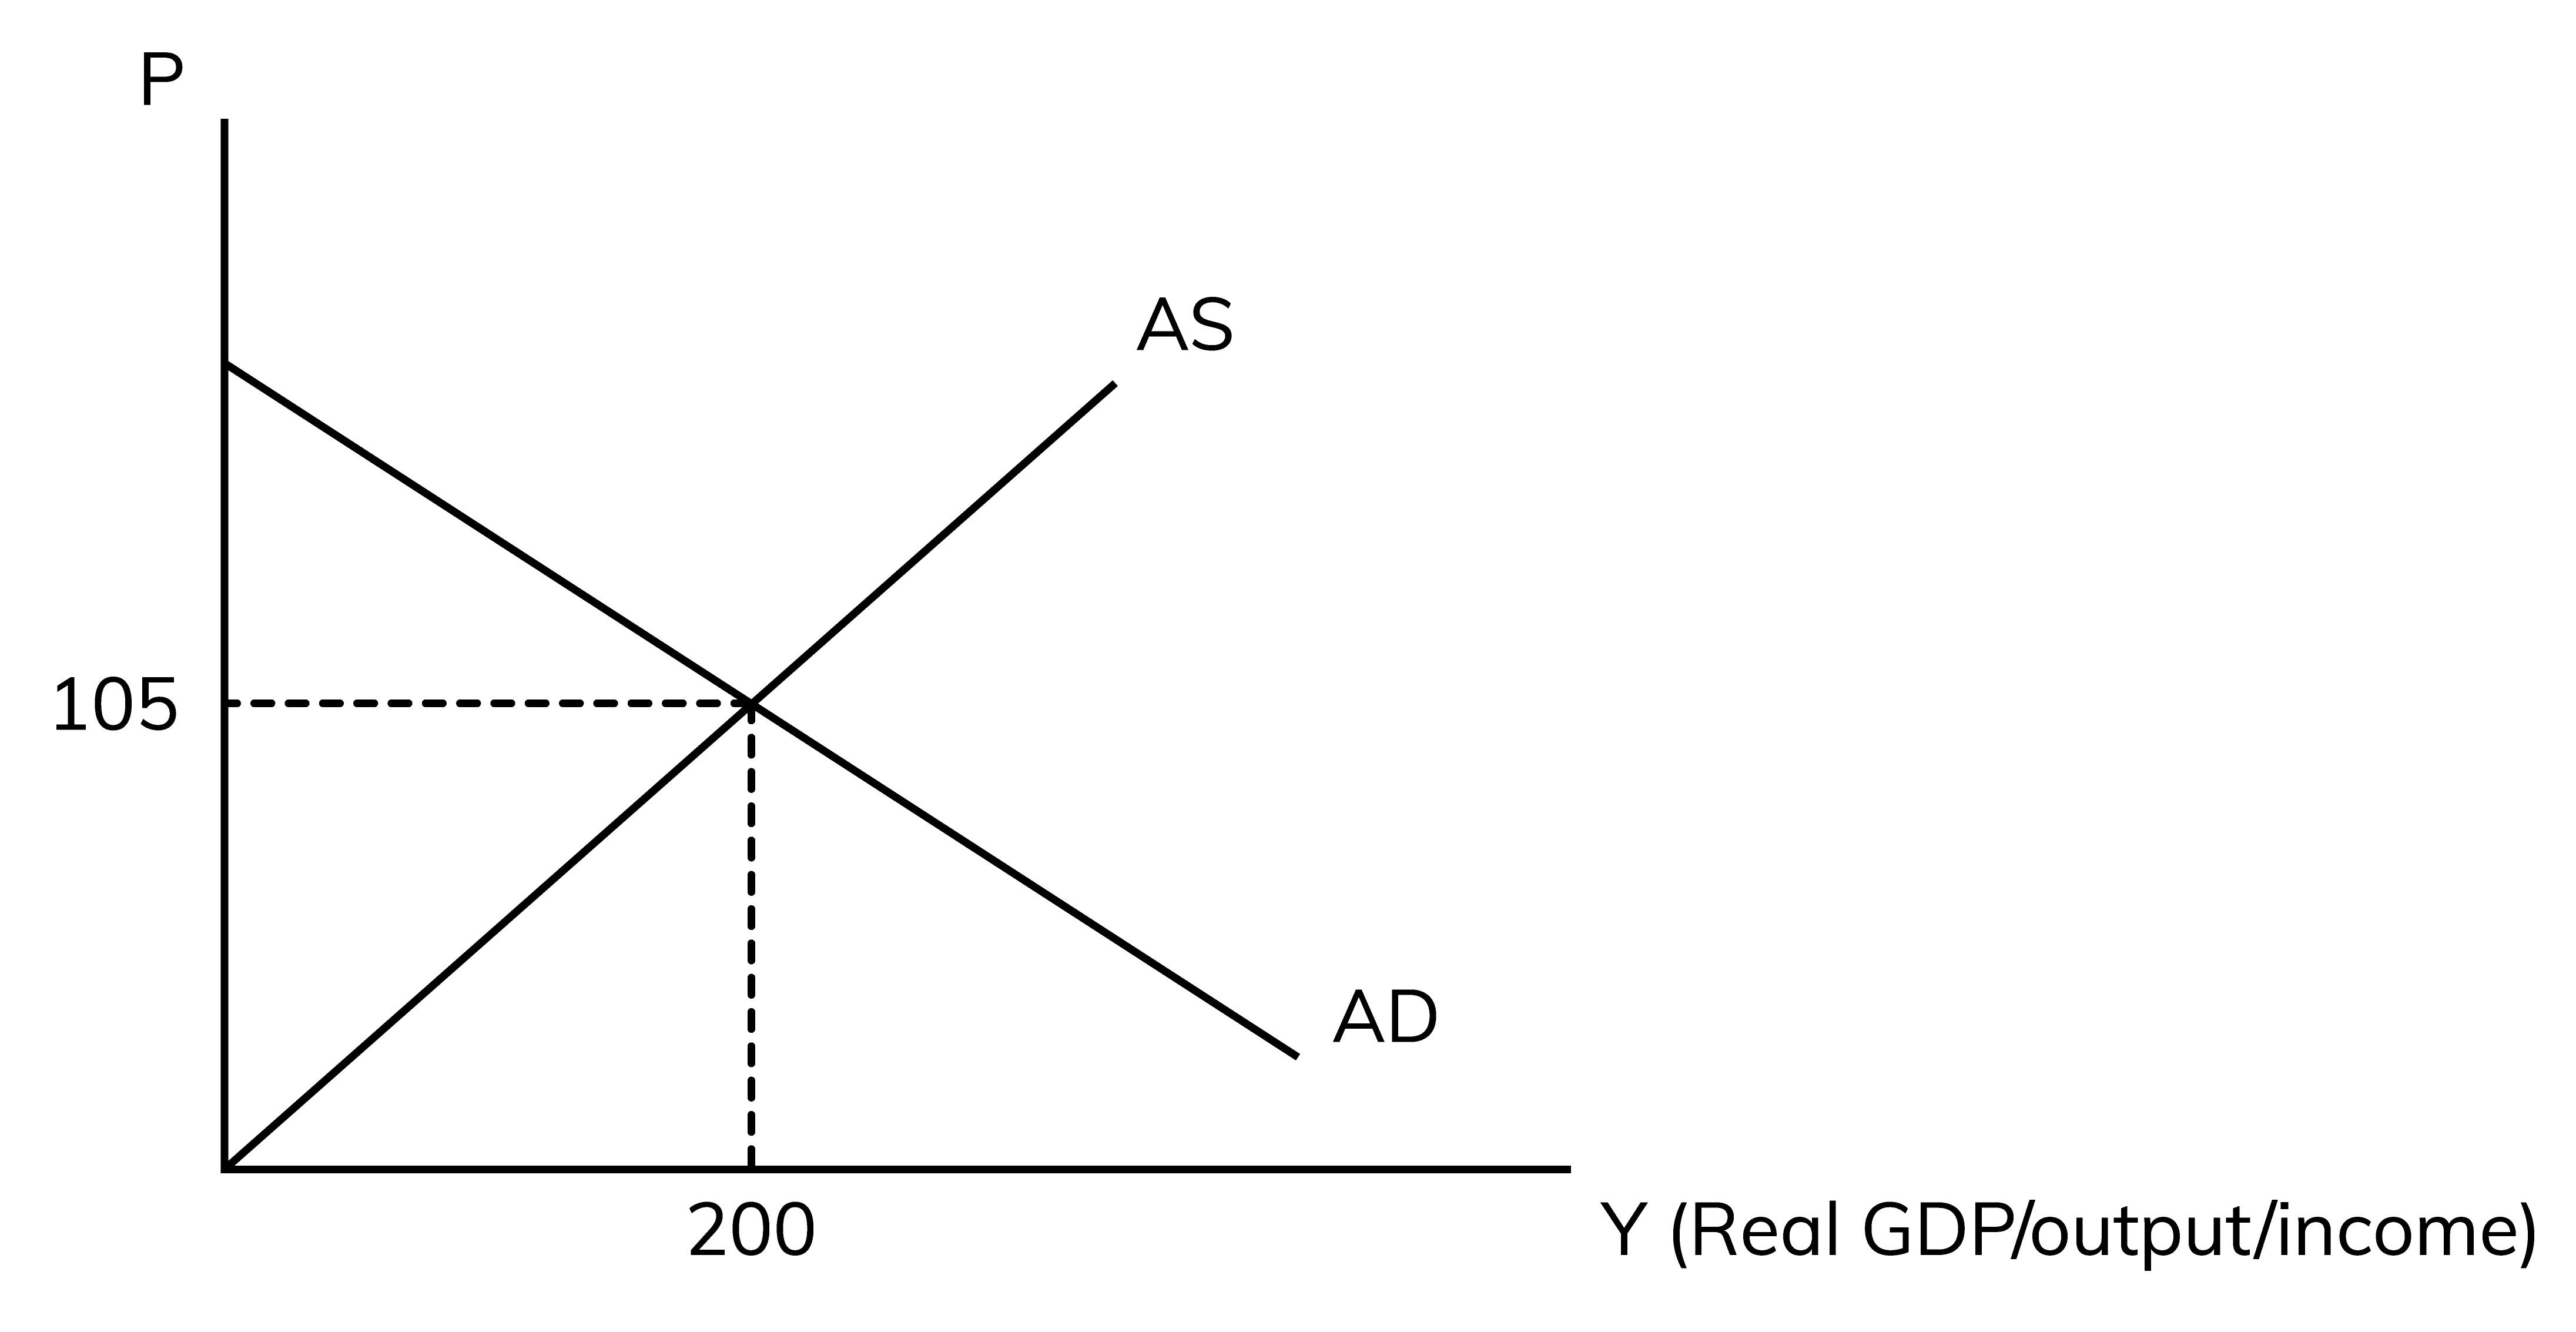
- When AEincreasesit will shift the AD (aggregate demand) to theright. This is because if we are planning to spend more that means we are demanding more.
- The change in the equilibrium output on the AE graph is the same as the horizontal shift in the AD line.