Wize University Microeconomics Textbook > Theory of Consumer Choice
Deriving the Demand Curve
Popular Courses
ECON 201
Concordia University
ECON 1021
Western University
Microeconomics
University Study Guides
ECON 1B03
McMaster University
ECON 1050
University of Guelph
ECON 101
University of Alberta
Microeconomics
General Course
ECO101H1
University of Toronto
Microeconomics
University Study Guides
ECON 101
University of Waterloo
ECON 110A
Queen's University
ECN 104
Toronto Metropolitan University
ECON 1000
York University
ECON 111
Queen's University
ECON 103
Simon Fraser University
ECON-1100
University of Windsor
MET EC 101
Boston University
ECON-B 251
Indiana University - Bloomington
ECN 101
Toronto Metropolitan University
ECON 1010
University of Manitoba

0:00 / 0:00
Deriving the Demand Curve
The demand curve can be derived (found) by looking at the optimal bundle from the indifference curve graph.

Example: Let's say the consumer's income is $100.
- In the diagrams above, as the budget line rotates to the right, it means the price of good X must havedecreased
- This means the price of X dropped from100/10 = $10to100/20 = $5and the quantity consumed of X at the optimal bundle increased from 6 to 12 units.
- This can be seen on the demand curve in the second diagram.

0:00 / 0:00
Example: Deriving the Demand Curve
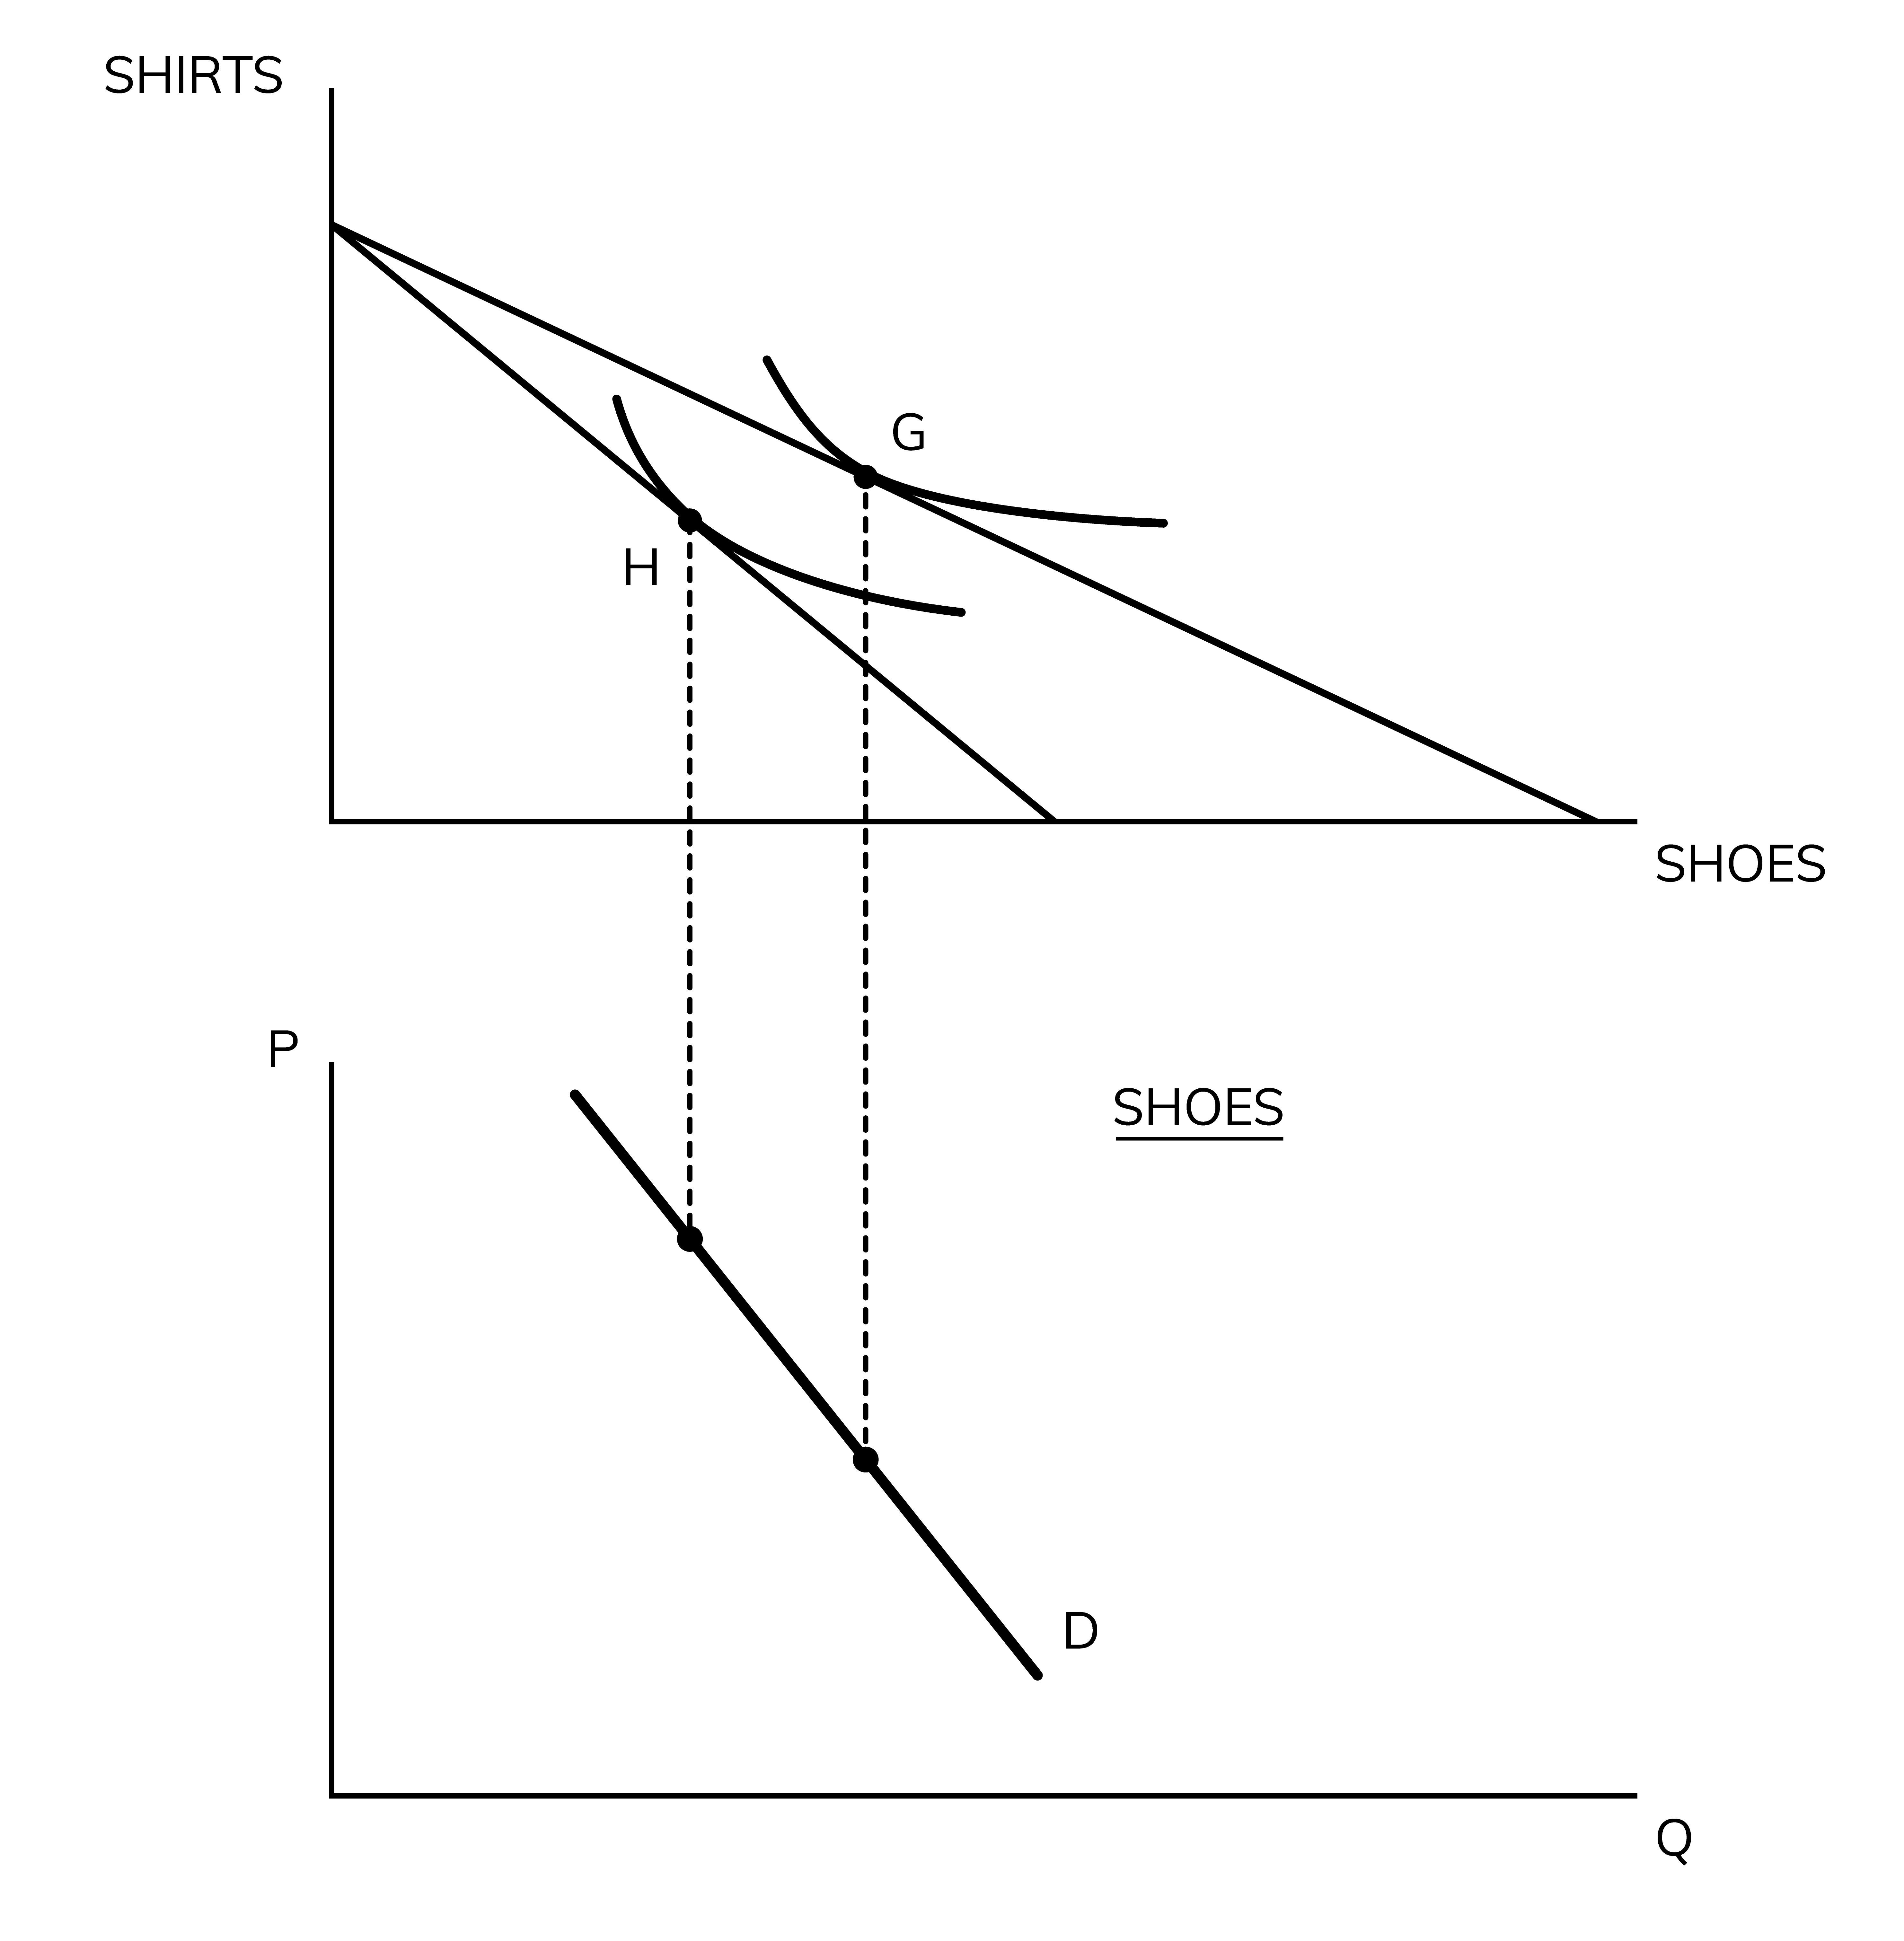
In the diagram above, as the consumer moves from point G to point H, it implies that there is a:
A) shift to the left in demand for shoes
B) shift to the right in demand for shoes
C) downward movement along demand for shoes
D) upward movement along demand for shoes
D.
A movement from point G to H is on a steeper budget constraint which means that the price of shoes have increased. A change in price only causes a movement along the demand curve. Since price is increasing it means there must be an upward movement along the demand.