Wize University Calculus 2 Textbook > Parametric & Polar Curves
Polar Coordinates
Popular Courses
Calculus 2
University Study Guides
AP Calculus (BC) Exam Prep Course
AP Exam Prep
Calculus 2
General Course
CALCULUS 1301A/B
Western University
Calculus 2
University Study Guides
MATH 267
University of Calgary
MATH 101
University of Alberta
SC/MATH 1014 3.00
York University
MATH 117
University of Waterloo
NMM 1414A/B
Western University
MATH 101
University of Victoria
MAT187H1
University of Toronto
MTH 240
Toronto Metropolitan University
MATH 118
University of Waterloo
MATH*1210
University of Guelph
MATH 1700
University of Manitoba
MATH 119
University of Waterloo
MATH 1226
Virginia Tech
MATH 1010
Dalhousie University
MATH 20B
University of California - San Diego
0:00 / 0:00
Polar Coordinates
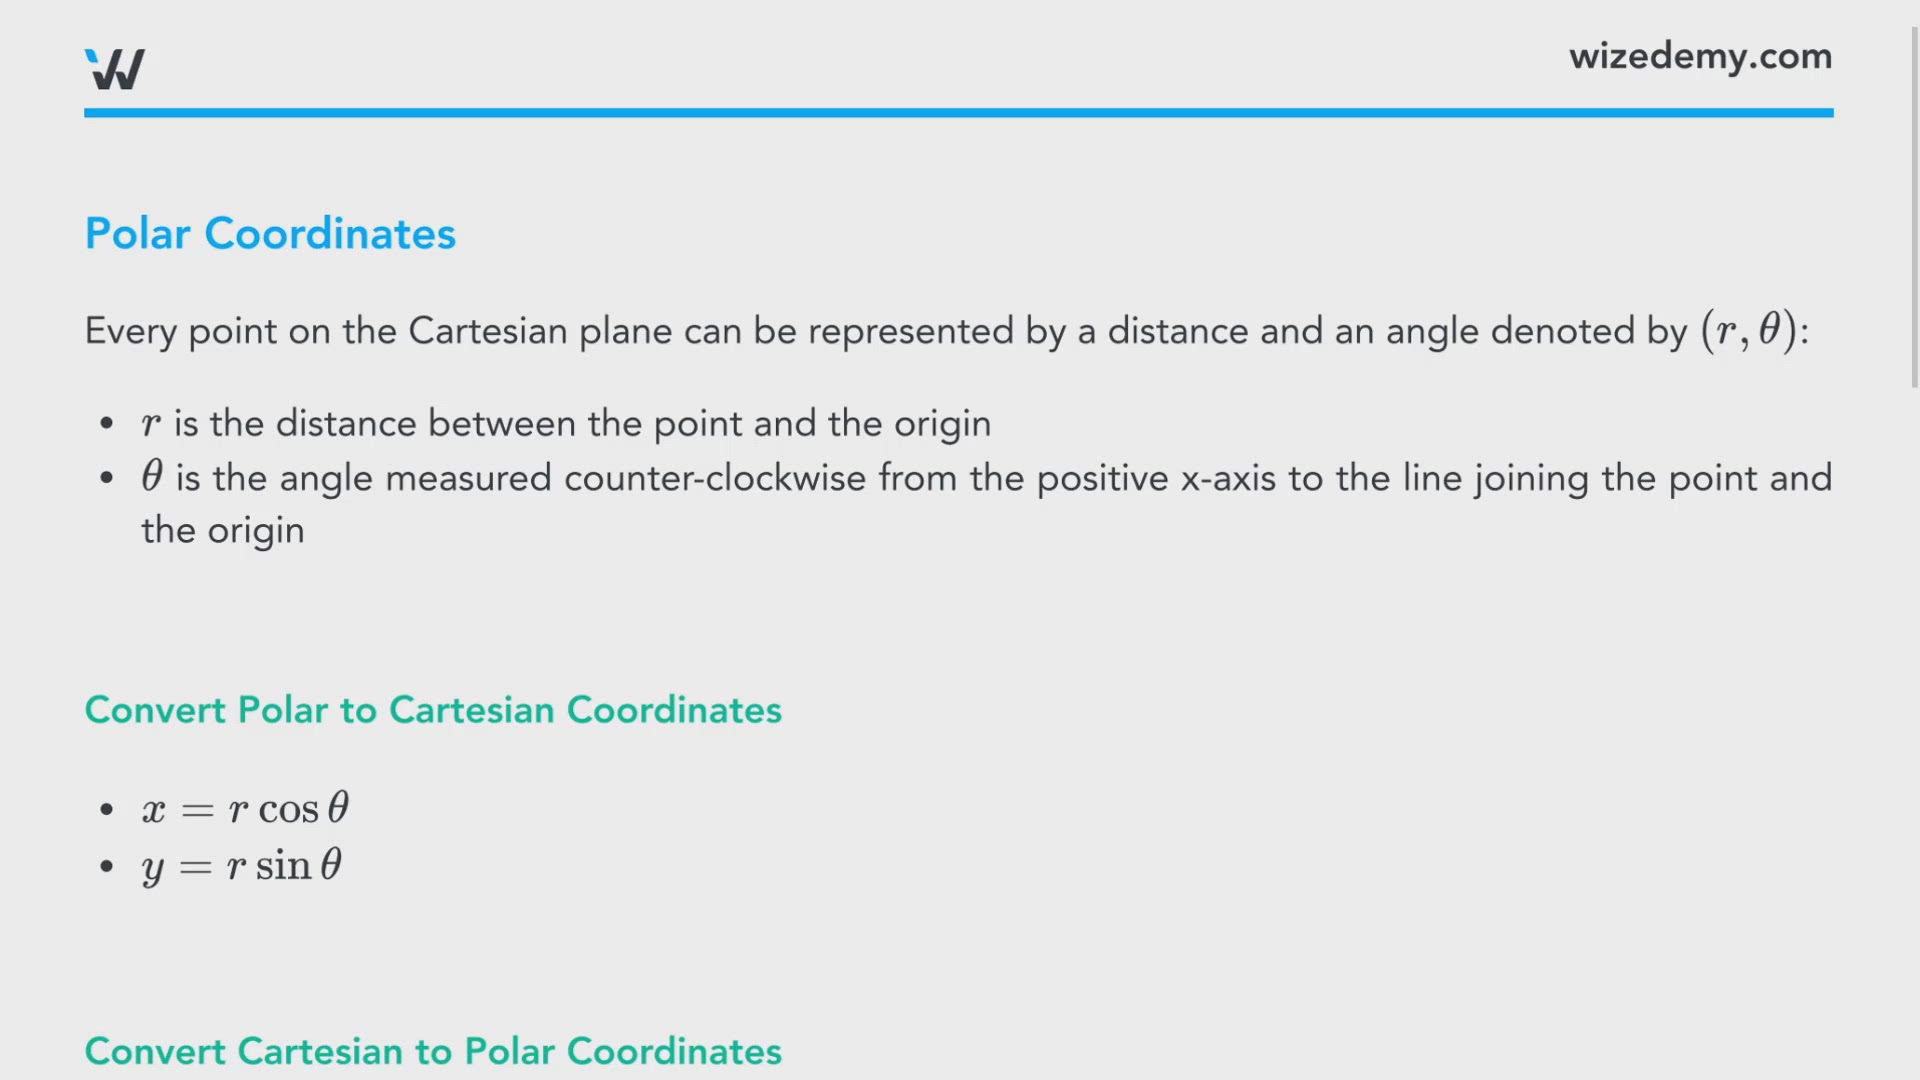
Every point on the Cartesian plane can be represented by a distance and an angle denoted by :
- is the distance between the point and the origin
- is the angle measured counter-clockwise from the positive x-axis to the line joining the point and the origin
Convert Polar to Cartesian Coordinates
Convert Cartesian to Polar Coordinates
Polar Curves
We can graph curves of the form when the interval for is given.
Example: Converting Coordinates
a.) Plot the polar points , , and on the Cartesian plane. Then convert them to Cartesian coordinates.
In Cartesian coordinates, we have ..
Therefore, the cartesian coordinates are all .
b.) Convert the Cartesian point to Polar Coordinates.
In Polar Coordinates and .
Therefore, the polar coordinates are .
0:00 / 0:00
Graphing Polar Curves
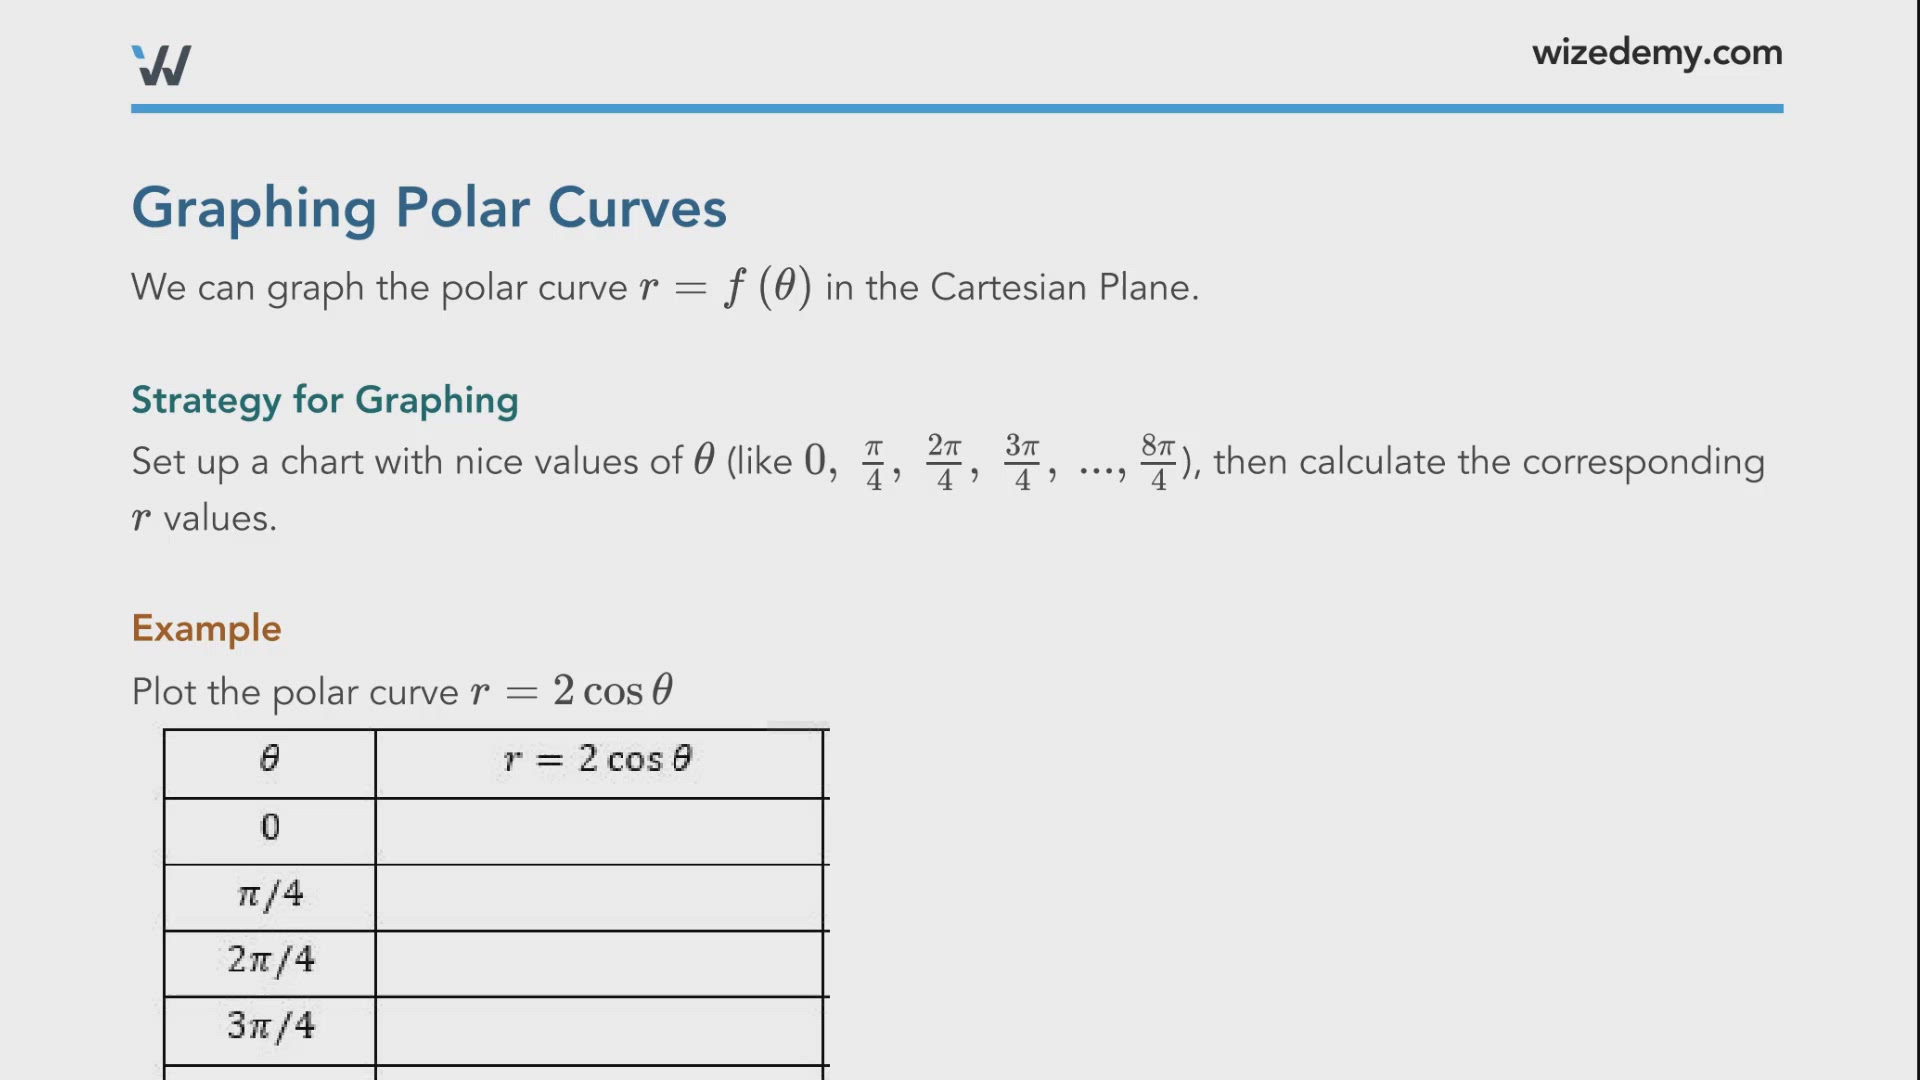
We can graph the polar curve in the Cartesian Plane.
Strategy for Graphing
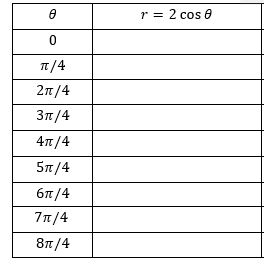
Set up a chart with nice values of (like ), then calculate the corresponding values.
Example
Plot the polar curve
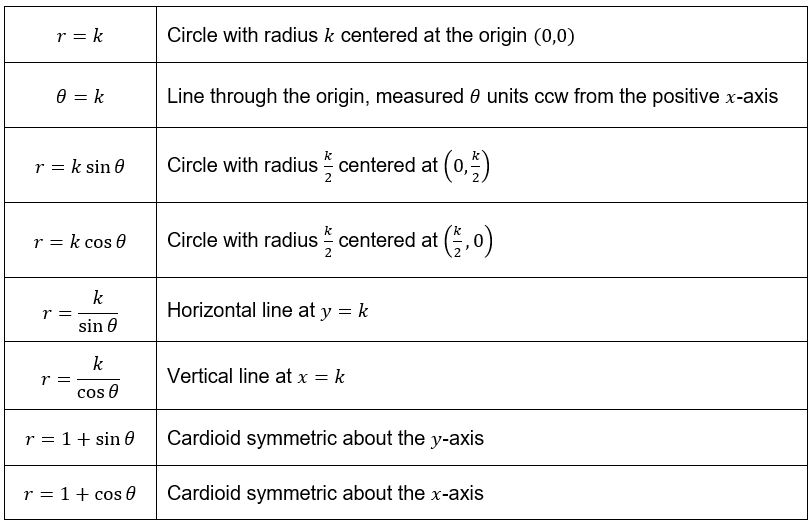
Some Common Polar Curves
Practice Question
Plot the polar curves and .
Practice Question
Convert the equation of the curve to polar coordinates.
Practice Question
Match the following graphs with its corresponding polar curve equation.
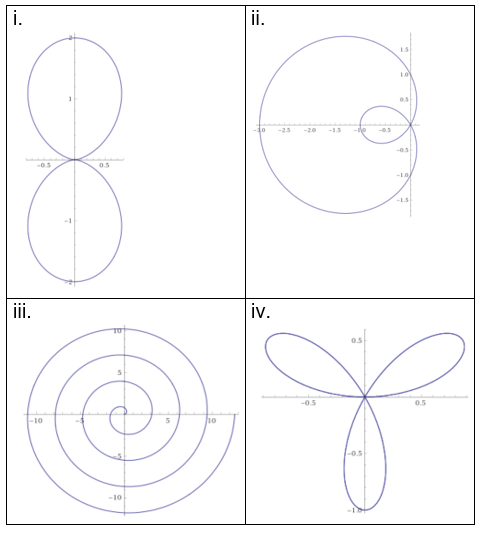
a.)
b.)
c.)
d.)
A.
B.
C.
D.
i.
ii.
iii.
iv.