Popular Courses
CHEM 2213A/B
Western University
Organic Chemistry
University Study Guides
DAT
General Course
Organic Chemistry
General Course
Organic Chemistry
University Study Guides
CHEM 351
University of Calgary
CHEM 212
McGill University
CHEM 231
University of Victoria
CHEM 2OA3
McMaster University
CHEM 2223B
Western University
CHEM 282
Queen's University
CHY 142
Toronto Metropolitan University
CHEM 222
McGill University
CHEM 2401
Dalhousie University
CHEM 2E03
McMaster University
CHEM 281
Simon Fraser University
CHEM 266
University of Waterloo
CHEM 250
University of Saskatchewan
CHM247H1
University of Toronto
CHEM 213
University of British Columbia
0:00 / 0:00
Mass Spectrometry (MS)
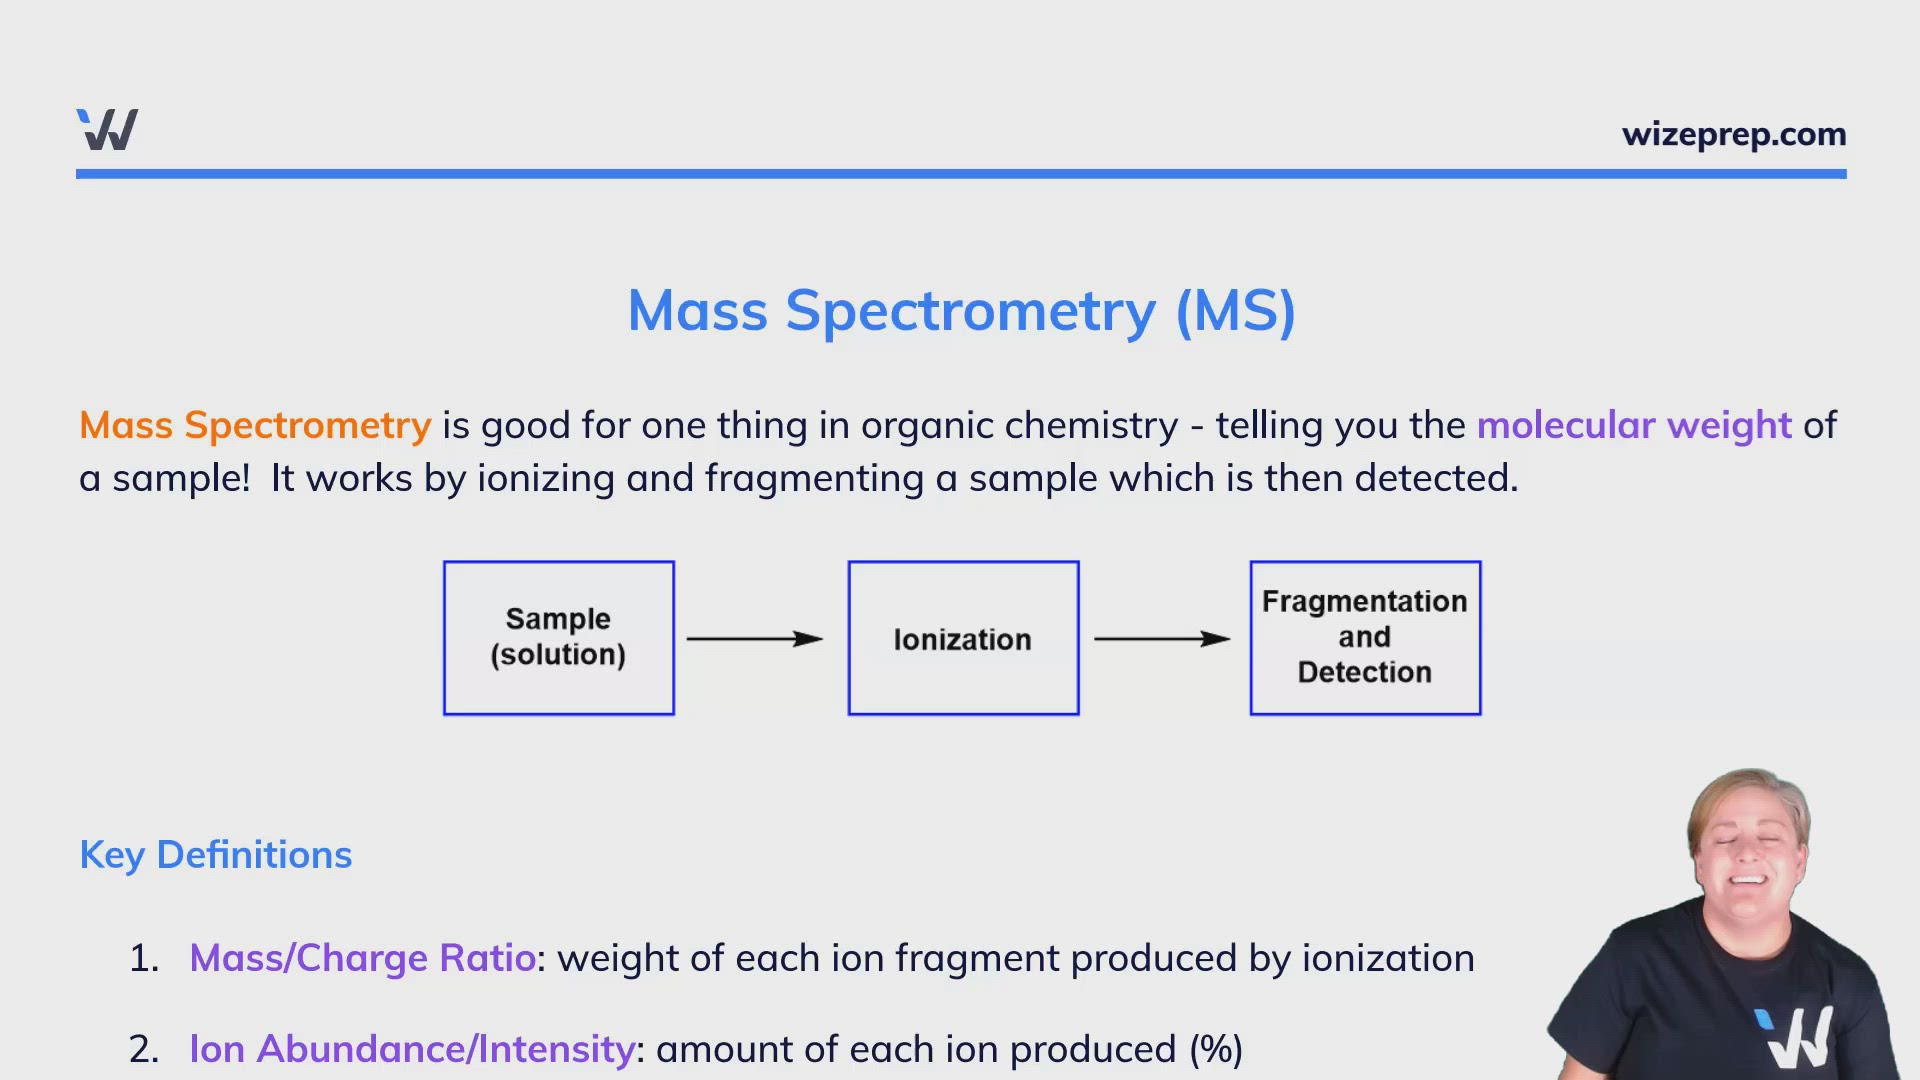
Mass Spectrometry is good for one thing in organic chemistry - telling you the molecular weight of a sample! It works by ionizing and fragmenting a sample which is then detected.

Key Definitions
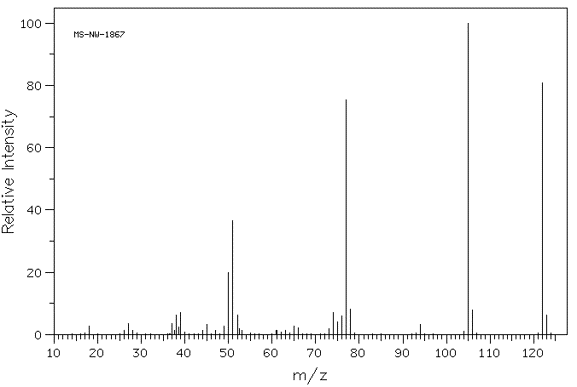
- Mass/Charge Ratio: weight of each ion fragment produced by ionization
- Ion Abundance/Intensity: amount of each ion produced (%)
- Base Peak: tallest peak in spectrum (most stable)
- Molecular Ion: peak of original starting compound
- Isotope Peaks: ions containing heavier isotopes (12C vs. 13C)
Example: mass Spectrum of Benzoic Acid

Isotopes in Mass Spectrometry
Different isotopes of atoms will be seen in a mass spectrum. In some cases, these isotope peaks are fairly large and can serve as diagnostic tools. For example, Boron, Chlorine and Bromine have very distinct isotope patterns.
Carbon: 12C (99%), 13C (1%)
Boron: 10B (20%), 11B (80%)
Chlorine: 35Cl (76%), 37Cl (24%)
Bromine: 79Br (51%), 81Br (49%)
Using MS to determining # of Carbons
We can use MS to estimate the number of carbon atoms in a compound. It uses the ratio of the mass peak for the 13C isotope to the mass peak of the 12C isotope. The equation we use is as follows:
0:00 / 0:00
Example: Mass Spectrometry
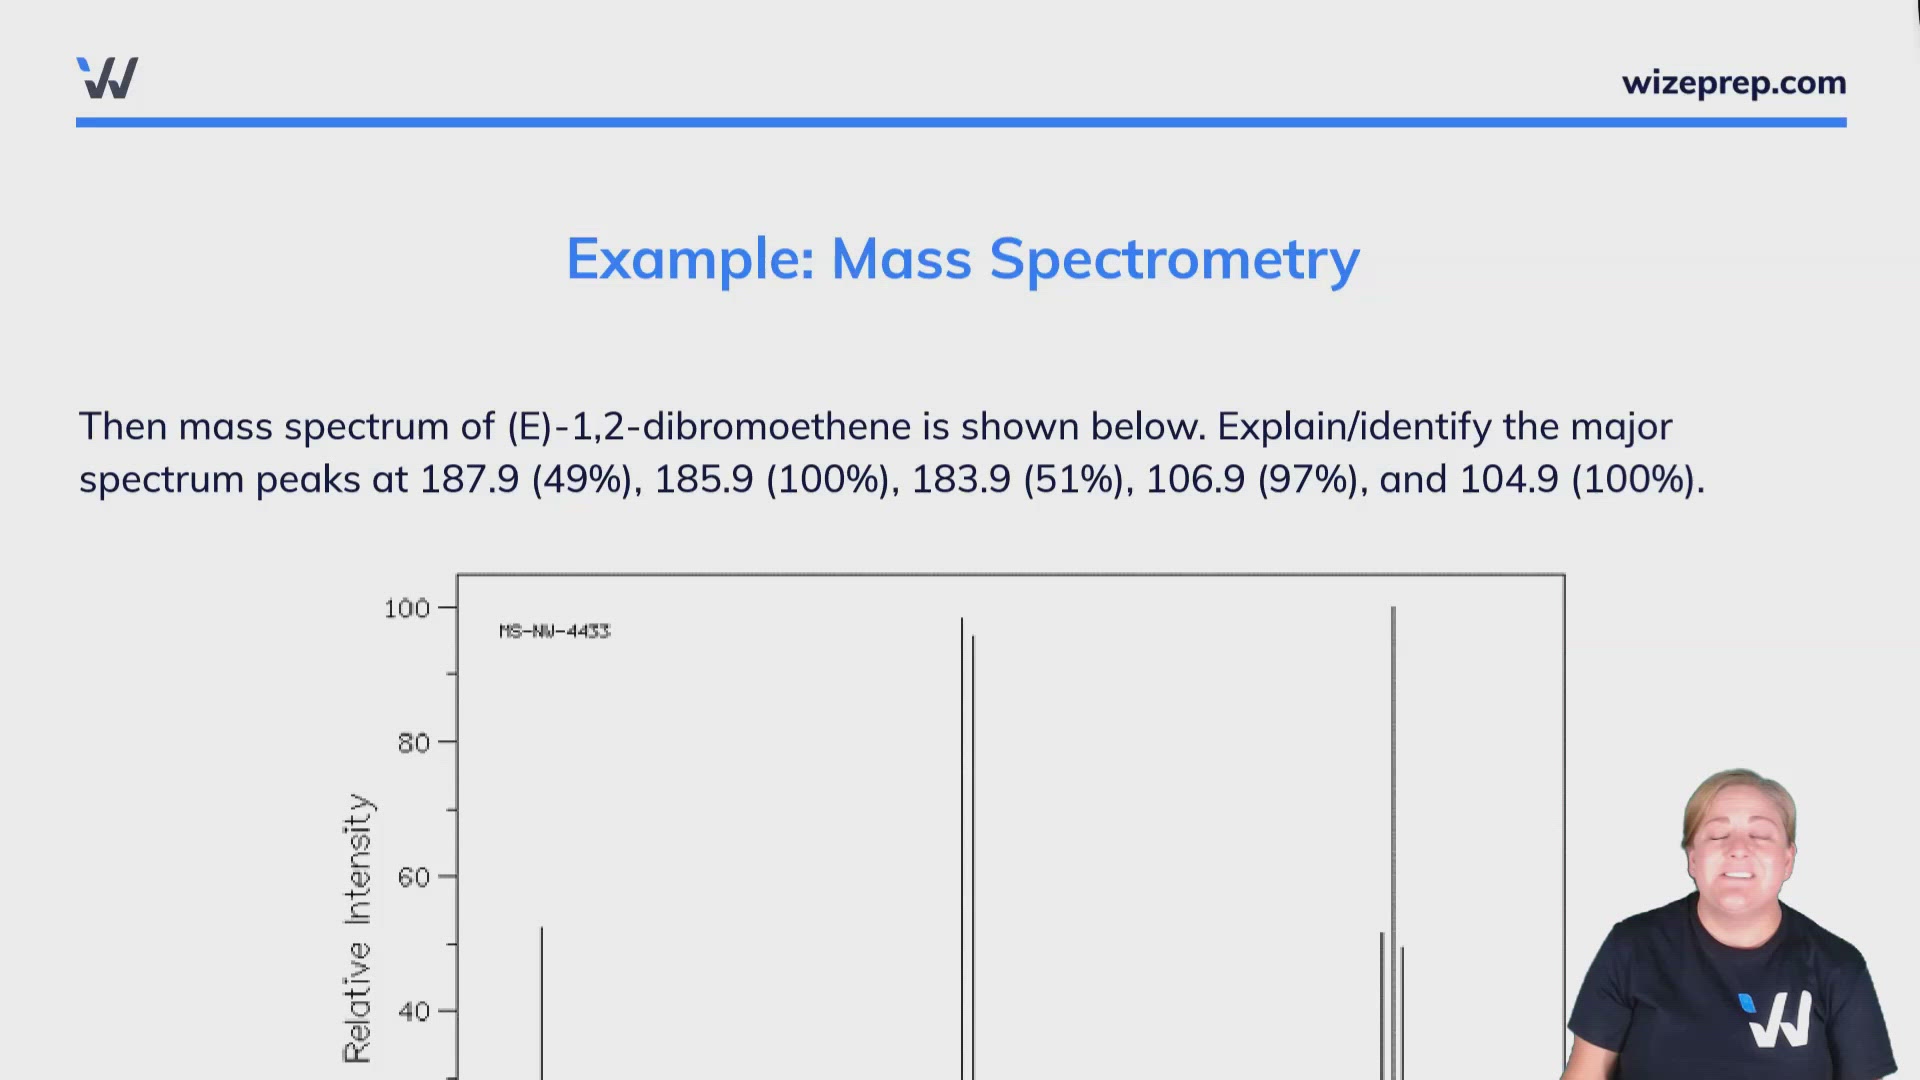
Then mass spectrum of (E)-1,2-dibromoethene is shown below. Explain/identify the major spectrum peaks at 187.9 (49%), 185.9 (100%), 183.9 (51%), 106.9 (97%), and 104.9 (100%).
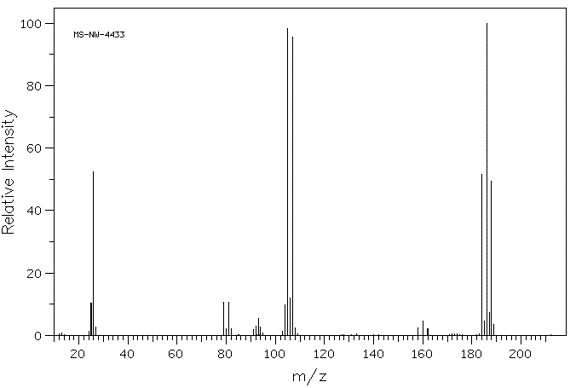
- bromine has two isotopes, Br-79 and Br-81 which are both 50% abundant
- the peaks at 188/186/184 in 50%/100%/50% ratios are the parent molecule (C2Br2H2) with the different isotopes of bromine
- the peak at 188 is Br-81/Br-81
- the peak at 184 is Br-79/Br-79
- the peak at 186 is Br-79/Br-81 and Br-81/Br-79
- this gives the 1:2:1 ratio
- the peaks at 107/105 are from the lost of a single bromine atom leaving one behind with its two isotopes in a 50:50 mixture
0:00 / 0:00
Example: Mass Spectrometry
Below is the mass spectrum of 2-pentene. Label the molecular ion and base peak. Provide the structure of the base peak and explain its formation.
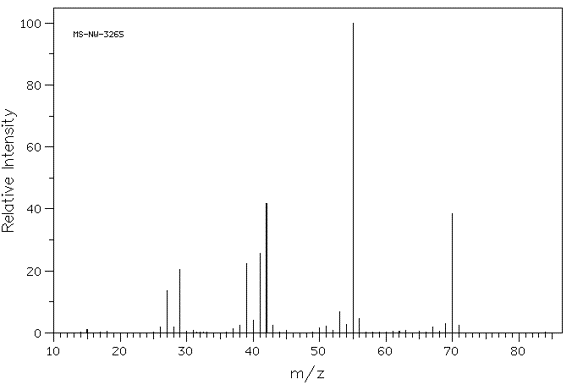
- the molecular ion peak is for the molecule before fragmentation - this is found at m/z = 70 as its molecular weight is 70 g/mol
- the base peak is the tallest peak and is found at m/z = 55 (i.e., the molecular weight is 55 g/mol)
- this is from the loss of a methyl (CH3) group which generates a carbon radical which is stabilized through resonance
0:00 / 0:00
Example: Mass Spectrometry
The mass spectrum of tert-butyl chloride (2-chloro-2-methylpropane) does not show it's molecular ion. There is three key diagnostic signals at m/z = 79, 77, and 57. What are the structures of the molecules that give rise to these signals (hint: be specific with any heteroatom isotopes).
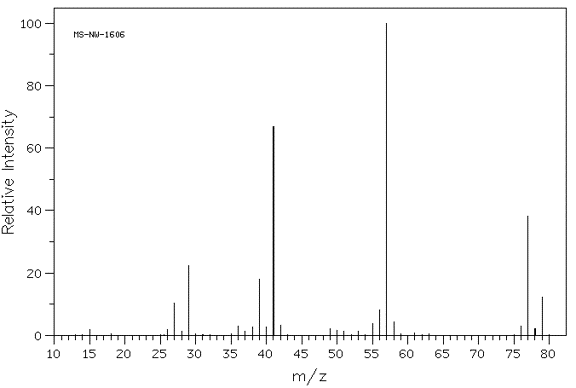
- the peak at 57 is a result of loss of the chlorine atom (the radical generated is stabilized on a tertiary sp3 hybridized carbon atom)
- the peaks at 77/79 are from the loss of a methyl (CH3) group
- there are two isotopes of chlorine Cl-37 and Cl-35 in a 75%:25% ratio