Popular Courses
MCAT
General Course
Intro to Physics
University Study Guides
PHYSICS 1D03
McMaster University
Physics
General Course
PHYS 115
Queen's University
PHYS 211
University of Calgary
PCS 211
Toronto Metropolitan University
PHYS*1300
University of Guelph
Intro to Physics
University Study Guides
PHY 1321
University of Ottawa
APSC 111
Queen's University
PCS 120
Toronto Metropolitan University
LE/PHYS 1800 3.00
York University
PHYS-1400
University of Windsor
PHY 1331
University of Ottawa
PHYS 142
McGill University
PHYS 115
University of Waterloo
PHYS 117
University of British Columbia
PHYS 117
University of British Columbia
ENGG 212
University of Calgary
0:00 / 0:00
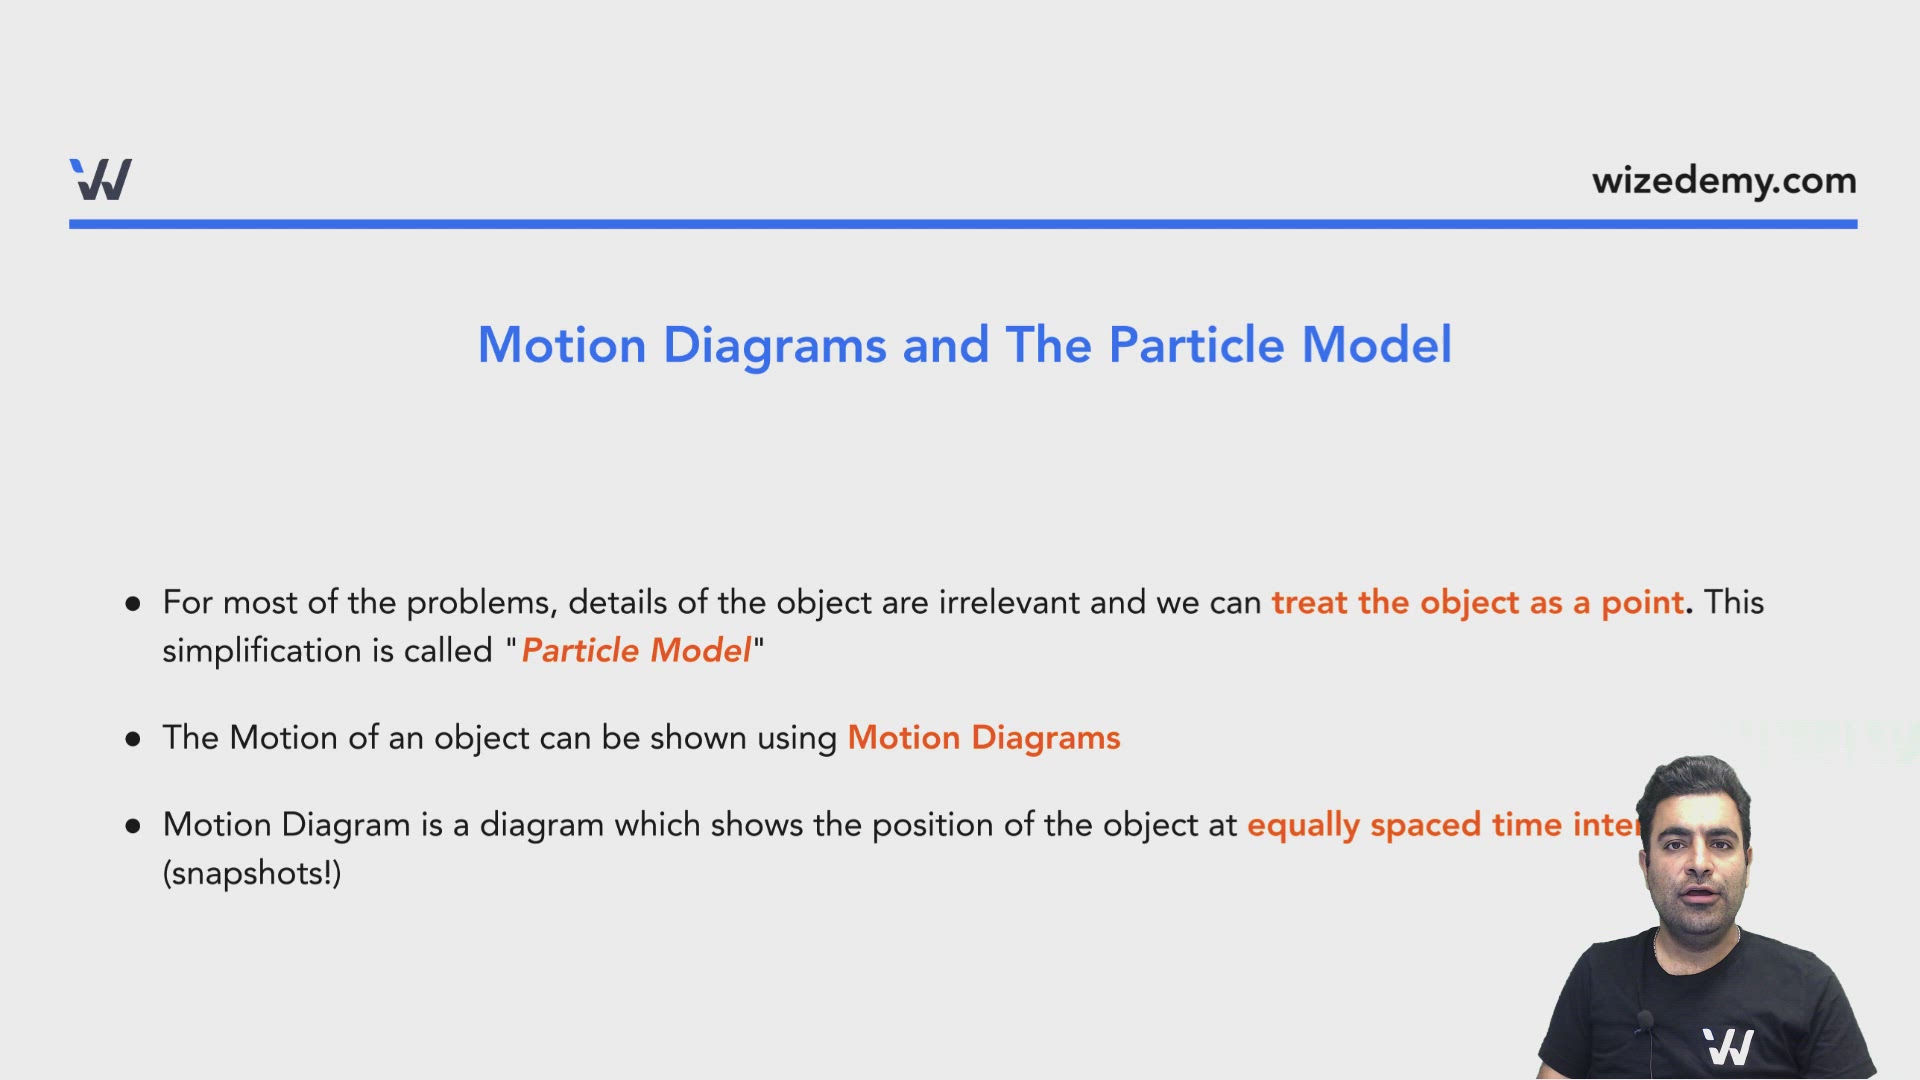
Motion Diagrams and The Particle Model
- For most of the problems, details of the object are irrelevant and we can treat the object as a point. This simplification is called "Particle Model"
- The Motion of an object can be shown using Motion Diagrams
- Motion Diagram is a diagram which shows the position of the object at equally spaced time intervals (snapshots!)
- If the space between snapshots remains constant, the object moves with constant velocity.
- If the space between snapshots is getting bigger, the object is accelerating.
- If the space between snapshots is getting smaller, the object is decelerating.
- Displacement vector is a vector connecting two consecutive points.
- The direction of the average velocity is the same as the direction of displacement vector and is called direction of motion! So, it motion diagrams it is a vector parallel to displacement vector!
- The acceleration vector in a motion diagram could be found by subtracting two consecutive velocities and is usually shown as a vector next to the points.

0:00 / 0:00
Example: Motion Diagram
A kid releases a ball from the height of above the ground. The ball hits the ground and bounces off to the height of above the ground. Draw the motion diagram of the ball.

Practice: Position vs. Time Graphs
Describe the motion depicted in each of the following graphs:

A.
Acceleration in the West Direction
B.
Deceleration in the Upwards Direction
C.
Deceleration in the West Direction
D.
Constant Velocity in the negative North Direction
E.
Constant Velocity in the negative North Direction
A
B
C
D
E