Wize University Physics Textbook (Master) > Electric Potential and Potential Energy
Relationship Between Electric Field and Potential
Popular Courses
MCAT
General Course
PHYSICS 1202A/B
Western University
PHYSICS 1E03
McMaster University
PHYS*1300
University of Guelph
PHYS 223
University of Calgary
PHYSICS 1402A/B
Western University
PHYS 205
Concordia University
PCS 120
Toronto Metropolitan University
PHY 1122
University of Ottawa
PHYS 142
McGill University
ENGG 212
University of Calgary
PHY132H1
University of Toronto
PHY132H1
University of Toronto
PHYS-1300
University of Windsor
PHY 1121
University of Ottawa
PHYS 121
University of Waterloo
PHYSICS 1102A/B
Western University
PHYS 227
University of Calgary
SC/PHYS 2020 3.00
York University
PHYSICS 1AA3
McMaster University

0:00 / 0:00
Relationship between Electric Field and Potential
Electric field and electric potential are deeply connected. In this section, we'll see how to find one quantity given the other quantity and interpret graphs of the two quantities.
- Electric field is the rate of change (or slope) of electric potential with respect to position. In one dimension, this can be written as follows:
- In a two-dimensional or three-dimensional distribution, we need to consider the rate of change of potential in each dimension separately (remember, electric field is a vector)!
Wize Concept
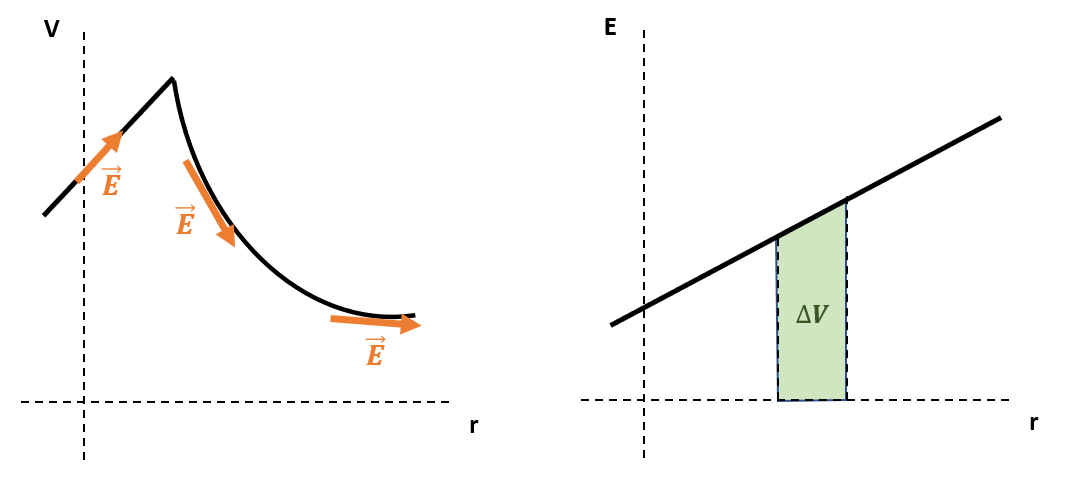
The negative sign in the above formulas has important physical meaning. The electric potential always decreases in the direction of electric field. If a positive charge is travelling along a field line, its potential is decreasing.
- The electric potential is the area under the curve of a graph of electric field vs. distance. However, since electric potential is always defined by comparing two points, we must have a reference point in addition to the graph to find the potential.

0:00 / 0:00
Example: Electric Field and Potential
a) A voltmeter measures that the potential difference between two points that are 12.0 cm apart is 9.5 V. If we assume that the electric field is constant, what is the magnitude of the electric field based on these measurements?
b) At position x = 0, the potential is 5 V. There is a constant electric field present with strength 1.5 N/C and it points to the left (that is, towards the negative x-direction). What is the potential at the position x = 7.0 meters?
For both of these problems, we use the relationship .
Part a)
This question only asks about the magnitude of the electric field, so we can neglect the minus sign. We simply need to divide the two values given:
Part b)
For this problem we can re-arrange the relationship, writing . Don't forget that the electric field points to the left (negative x-direction as specified in the question) so we need to keep the minus sign for the electric field.
Our result makes sense. If the electric field points to the left, then the potential should be higher to the right (electric field lines point from high to low potential).

0:00 / 0:00
Example: Graphing Electric Field and Potential
The electric potential along the x-axis has been shown in diagram below.
Sketch the corresponding electric field diagram. Hint: what are the units of the horizontal axis?
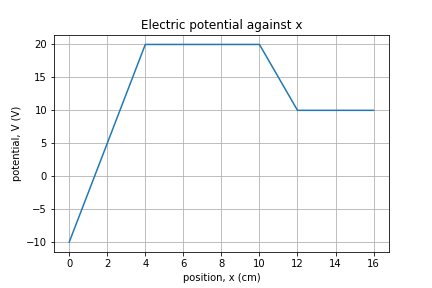
We'll use the rate of change formula:
We can see that the electric potential has four "sections", so we will use the formula four times:
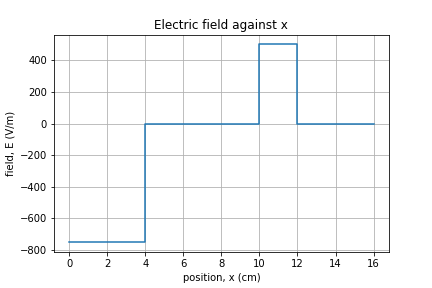
Thus, the diagram is:
Practice: Graphs of Field and Potential
a) For the following graph of electric potential, determine the electric field at and :
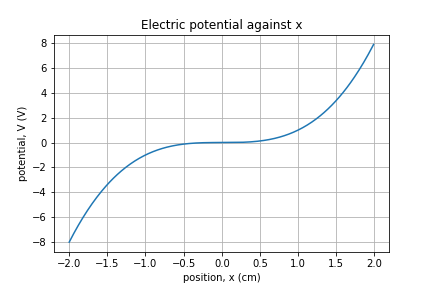
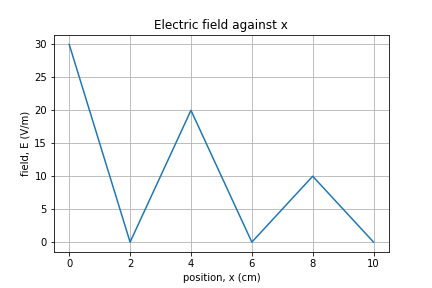
b) For the following graph of electric field, determine the electric potential atand, assuming that the potential at is 10 V.