Wize University Physics Textbook (Master) > Sound & Hearing
Sound Waves Patterns
Popular Courses
MCAT
General Course
Intro to Physics
University Study Guides
Physics
General Course
PHYSICS 1A03
McMaster University
PHYSICS 1202A/B
Western University
PHYSICS 1E03
McMaster University
PHYS*1300
University of Guelph
Intro to Physics
University Study Guides
PHYS 124
University of Alberta
PHYS 131
McGill University
PHYSICS 1402A/B
Western University
PHYS 205
Concordia University
PCS 120
Toronto Metropolitan University
PHYS 142
McGill University
ENGG 212
University of Calgary
PHY132H1
University of Toronto
PHY132H1
University of Toronto
PHYS 102B
University of Victoria
PHYS 111
University of Victoria
PHYS 1050
University of Manitoba
Sound Waves Patterns
Sound waves are longitudinal mechanical waves for which the direction of motion of particles in the medium is along the direction of the wave propagation.
Sound waves in air are produced by compression and rarefaction of air molecules. As a result of oscillation in the density of the air molecules, the pressure of air molecules also oscillates. So, a sound wave pattern can be shown by either displacement curve of air molecules or by pressure oscillation.
To understand this better, imagine an air pipe with an oscillating piston at one end of this air pipe. Let's consider the other end to be closed. When the piston moves, it will generates a wave of compression and rarefaction of air molecules along the pipe.
Note :
- Air molecules right beside the piston, move by the piston, so, they have maximum displacement and form an antinode in displacement curve.
- Air molecules at the closed end of the pipe remains stationary, and as a result, they form a node in the displacement curve.
Pressure Oscillations
Close to displacement antinodes, particles move together and there is almost no change in the density of particles, thus, no change in the pressure. So, these points form nodes of pressure oscillation.
In contrast, particles close to the node has the maximum change in the density, thus, maximum change in the pressure. So, these points form antinodes of pressure oscillation.
Wize Tip
For sound waves, displacement oscillations and pressure oscillations are out of the phase by such that nodes of one of them corresponds to the antinodes of the other one and vice versa.
Example: Pressure and Displacement
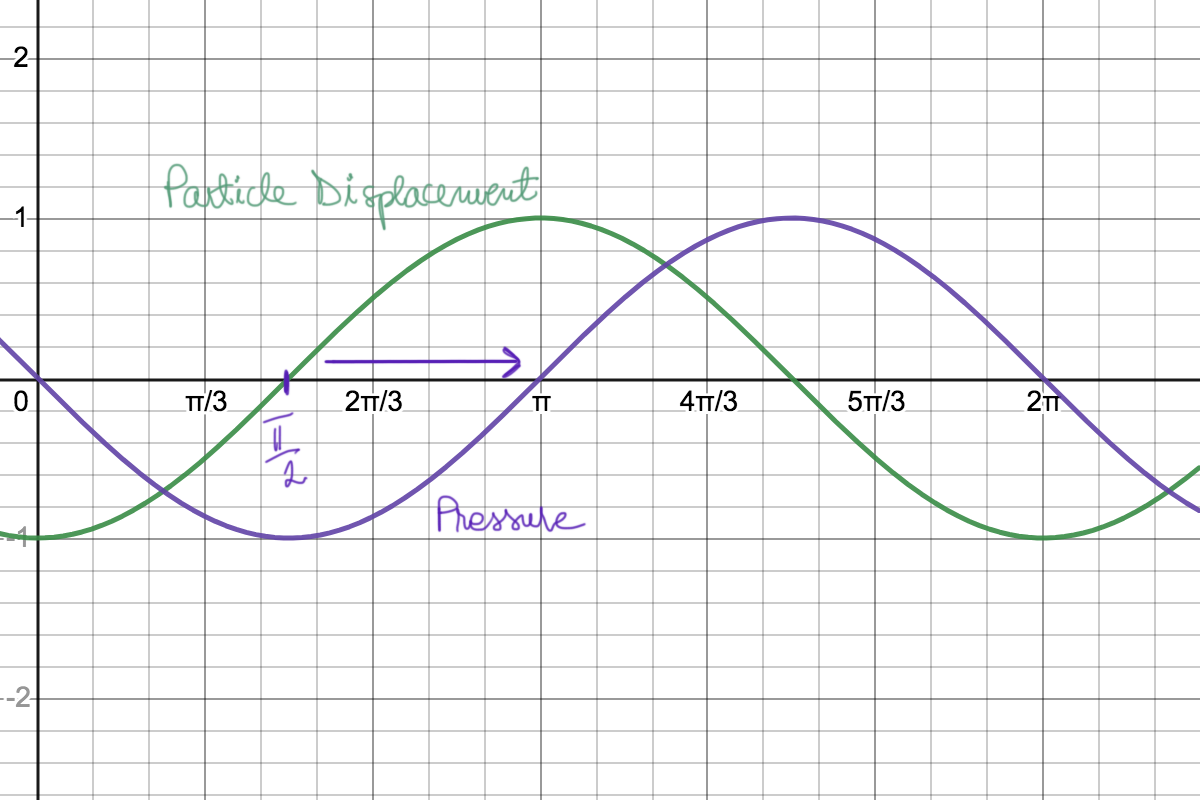
a) The following is a graph of the pressure along a sound wave. Draw the graph of the particle displacement on top of it.
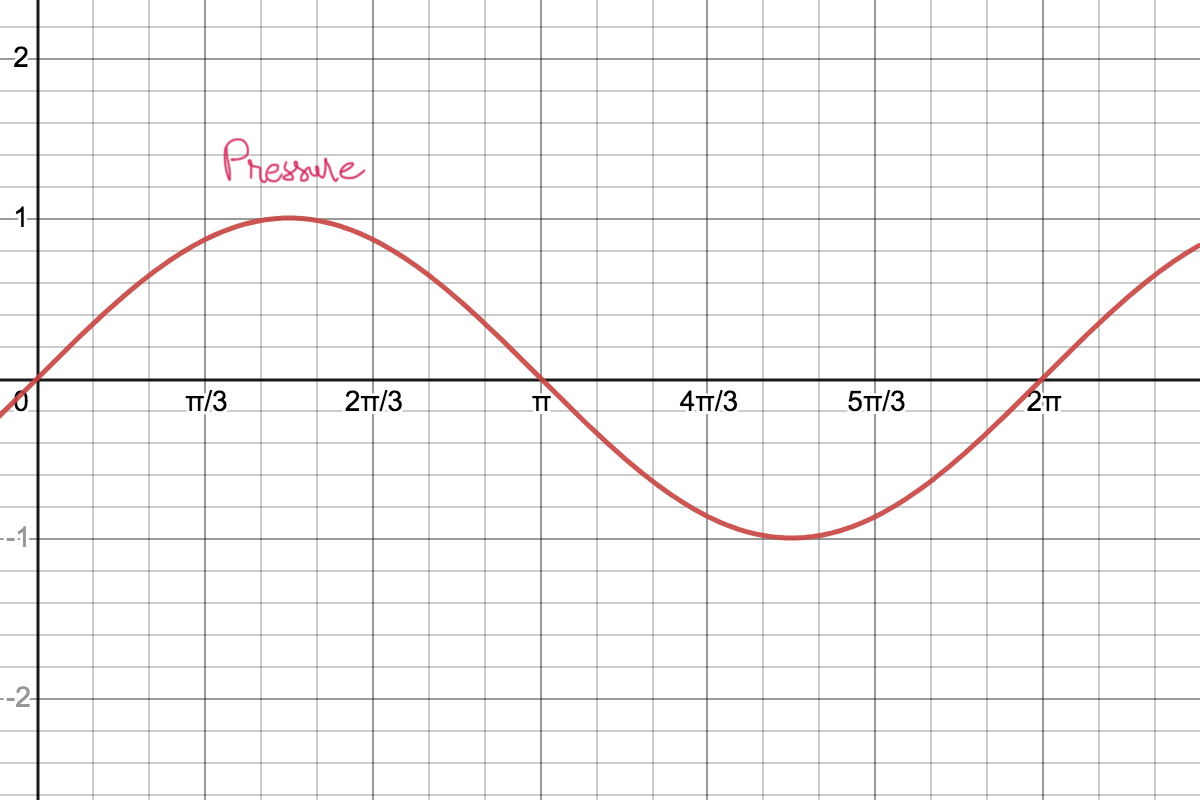
b) The following is a graph of the pressure along a sound wave. Draw the graph of the particle displacement on top of it.
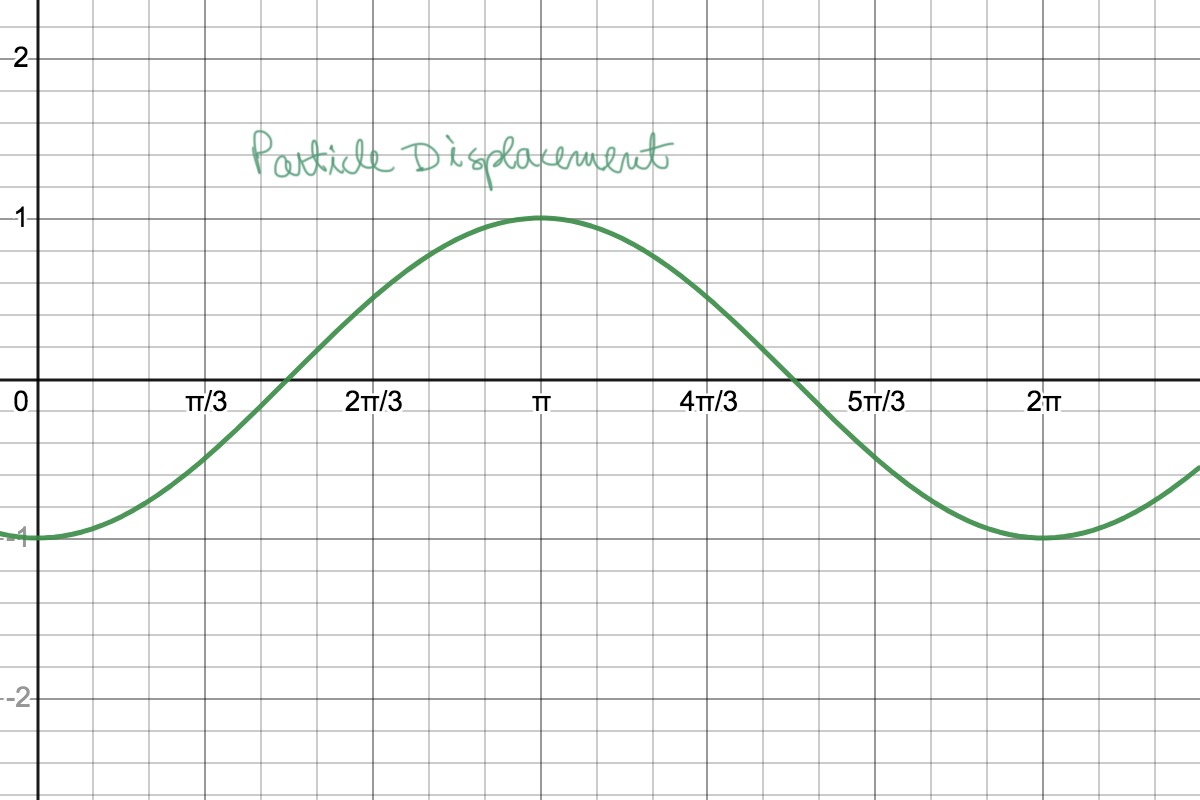
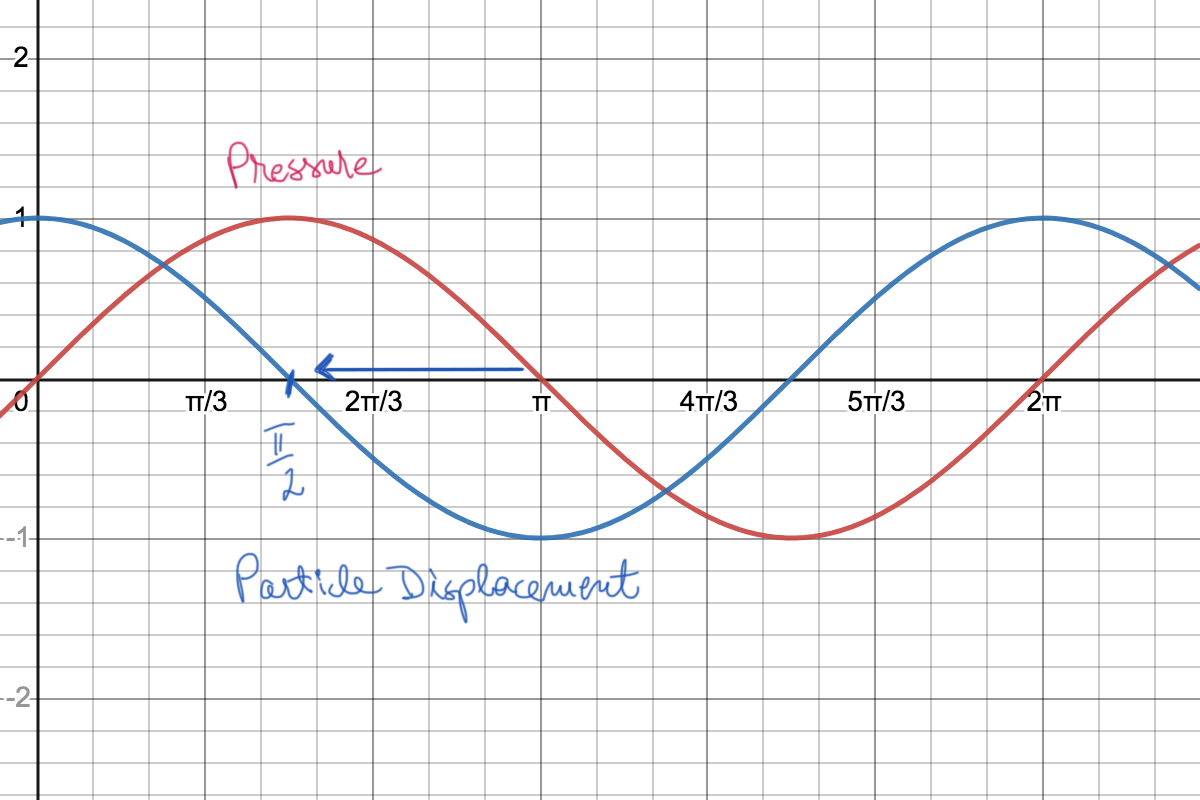
Points of max/min pressure correspond to zero particle displacement. Points of max/min particle displacement correspond to zero pressure (right in between the points of max/min pressure). Hence the shift between them.
- As we move along the axis from a min to a max pressure, the particles in that region are moving in the positive direction.
- As we move along the axis from a max to a min pressure, the particles in that region are moving in the negative direction.
This means that the pressure is ahead of the particle displacement, and particle displacement is behind pressure.
Part a)
The pressure is ahead of the particle displacement, so we should draw the displacement units behind the pressure.
Part b)
The displacement is behind the particle displacement, so we should draw the pressure units ahead of the displacement.