Wize University Statistics Textbook > Match Pairs (Dependent Means)
Hypothesis Testing for Matched Pairs
Popular Courses
STAT 151
University of Alberta
Statistics
General Course
Intro to Statistics
University Study Guides
COMM 191
University of British Columbia
STA 100
University of California - Davis
STAT 200
University of British Columbia
Intro to Statistics
University Study Guides
STATS 2035
Western University
STAT 161
University of Alberta
QMS 210
Toronto Metropolitan University
STAT 263
Queen's University
STAT*2040
University of Guelph
ENDG 319
University of Calgary
STAT 251
University of British Columbia
STATS 2B03
McMaster University
STAT 217
University of Calgary
COMM 162
Queen's University
STAT 1060
Dalhousie University
ECON 227
McGill University
STA220H1
University of Toronto
0:00 / 0:00
Hypothesis Test for Matched Pairs
When a hypothesis test is performed for matched pairs, the subjects or observations are matched in pairs and then we analyze the differences.
Wize Tip
Review Hypothesis Testing if you need a refresher of the five steps. (See: Hypothesis Testing with One Sample)
Hypotheses:
(there is no difference in the population mean of the differences)
(there is a difference in the population mean of the differences)
Wize Concept
Some textbooks use the following notations:
(there is no difference in the population mean of the differences)
(there is a difference in the population mean of the differences)
Basically, we compute the difference between the two means and plug the value into a one-sample -test on the differences.
- If the mean difference is zero, then the two means are not different.
- If the mean difference is statistically significantly not zero, then the two means are different.
is the sample mean of the differences
is the sample standard deviation of the differences
Test-statistic:
where such that:
Degrees of freedom:
where = number of pairs (or sample size)
Wize Concept
Some textbook uses the following notations:
where such that:
Wize Tip
How can you tell if two mean are dependent of each other, thereby requiring you to do a matched pairs -test? A classic example is when you are testing the same person before and after a treatment.
Example
Hank's Auto Mall sells used cars and got them all appraised by Auto Corp. He hired another car appraisal company, Vroom Car Appraisal, to get a second opinion on those same cars. Hank wants to see if there is a significant difference between the appraisal values for each of his cars. Is there evidence at the 5% significance level? Eight cars were randomly sampled. Values are in $,000's:
The mean appraisal values for each company are dependent on each other because they are based on the same 8 cars - each car was measured twice. In other words, the cars sampled were not drawn from different, independent populations. Rather, they are drawn from the sample population.
Sample mean of the differences,
Sample standard deviation of the differences,
Sample size, (not 16!)
What does mean in this example (in plain English)?
The mean difference in appraisal value between the two appraisers is $10,000.
Hypotheses:
(two-tail test)
Test-statistic:
P-value:

t-table: p-value
Software: p-value = 0.0287
Since the -value is less than , we have evidence that there is a difference between the two appraisal values between the two appraisers.
What happens if we incorrectly do a two-sample test, given the paired nature of the data?
Since the variances are quite equal, suppose we incorrectly do a pooled two-sample test for independent means:
(Notice that now it looks like there are 16 cars being appraised, 8 each from 2 different populations!)
Using software: -value = 0.1198
In this case, the -value is greater than . Doing a two-sample test (incorrectly) suggests that no evidence that the two means differ.
Watch Out!
It is important that you can tell the difference between dependent means or independent means.
0:00 / 0:00
Example: Hypothesis Test for Matched Pairs
The cabbage diet, invented by Dr. Patch, aims at helping people lose weight. According to this diet, eating lots of cabbage soup can reduce your consumption of calories. Six people are asked to track the number of calories consumed during a regular week and a week when they were on the cabbage diet. The number of calories consumed is recorded below:
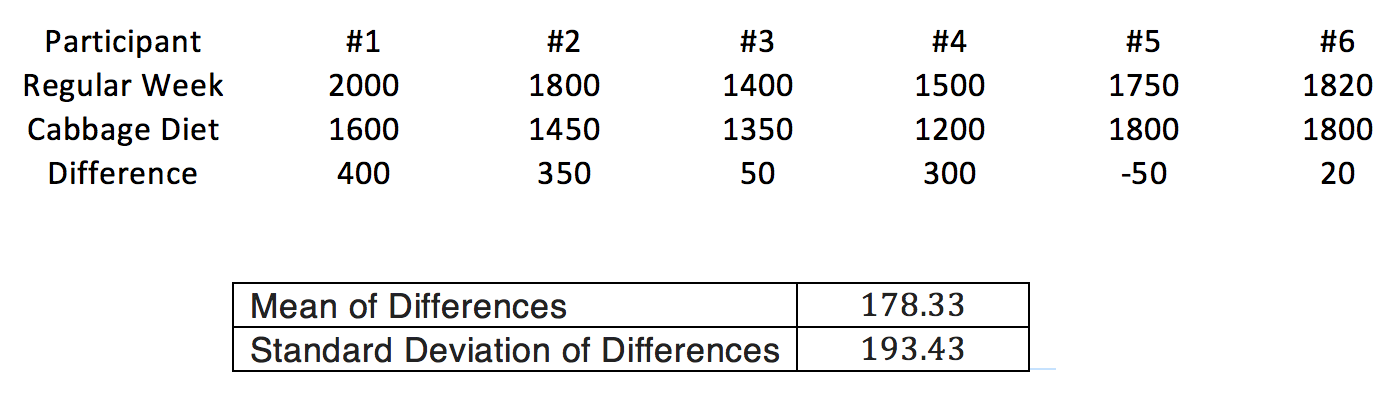
(a) State the null and alternative hypotheses.
Regular week Cabbage Diet Week
(one-tail test)
or
(one-tail test)
(b) Compute the test-statistic
(c) What the p-value?
so the one-sided p-value is between 0.025 and 0.05.
(d) At the 5% significance level, is there evidence that this diet reduces the consumption of calories?
Since the p-value is between 2.5% and 5%, it is less than 5% so reject .
Thus, there is evidence that this diet works.
(e) At the 1% significance level, is there evidence that this diet reduces the consumption of calories?
Since the p-value is between 2.5% and 5%, it is greater than 1% so we fail to reject .
Thus, there is no strong evidence that this diet works.
Twin Pines Winery takes their visitors to the gift shop first before the wine tasting. After the wine tasting, they bring them back to the gift shop. We want to compare the difference in spending at the gift shop before vs. after visitors experience the wine tasting. On average, visitors spend $1.78 more at the gift shop after the wine tasting with a standard deviation of $7.73. This is based on a random sample of 51 visitors.
(i) What is the critical value () if the significance level is ?