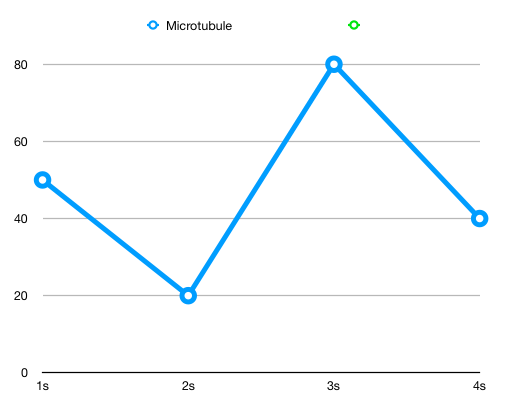
Explain what is happening in this graph with regards to microtubules and their …
Mark Yourself Question
- Grab a piece of paper and try this problem yourself.
- When you're done, check the "I have answered this question" box below.
- View the solution and report whether you got it right or wrong.
Explain what is happening in this graph with regards to microtubules and their dynamic instability. The x-axis is time and the y-axis is microtubule length.